Help us improve in just 2 minutes—share your thoughts in our reader survey.
California state executive official elections, 2014
2015 →
← 2013
|
| 2014 State Executive Official Elections |
| Alabama • Alaska • Arizona • Arkansas • California • Colorado • Connecticut • Delaware • Florida • Georgia • Hawaii • Idaho • Illinois • Indiana • Iowa • Kansas • Louisiana • Maine • Maryland • Massachusetts • Michigan • Minnesota • Missouri • Montana • Nebraska • Nevada • New Hampshire • New Mexico • New York • North Dakota • Ohio • Oklahoma • Oregon • Pennsylvania • Rhode Island • South Carolina • South Dakota • Tennessee • Texas • Utah • Vermont • Wisconsin • Wyoming |
| Partisan breakdown Candidates by office Voter turnout Key deadlines State executive organization Ballotpedia reports Recent news See also |
| News • Calendar |
Eight state executive positions were up for election in 2014 in the state of California.
California uses a top-two primary system, in which all candidates appear on the same ballot. The top two vote-getters, regardless of party affiliation, move on to the general election. In states that do not use a top-two system, all parties are usually able to put forward a candidate for the general election if they choose to.[1][2]
Unlike the top-two format used in some states (Louisiana and Georgia special elections for example), a general election between the top-two candidates in California occurs regardless of whether the top candidate received 50% of the vote in the first round of elections.
As of June 2025, California was one of five states to use a top-two primary system, or a variation of the top-two system. See here for more information.
For information about which offices are nominated via primary election, see this article.
The following offices were elected in 2014 in California:
- Governor of California
- Lieutenant Governor of California
- California Attorney General
- California Secretary of State
- California Treasurer
- California Controller
- California Superintendent
- California Insurance Commissioner
In addition to candidate lists and election results, this page includes information about important dates, how the state's executive branch is organized, as well as links to articles about recent news in races across the state.
Partisan breakdown
Heading into the November 4 election, the Democratic Party held seven of the eight state executive seats in California.
| California State Executives -- Partisan Breakdown | |||
|---|---|---|---|
| Party | As of November 4, 2014 | After the 2014 election | |
| Democratic Party | 7 | 7 | |
| Republican Party | 0 | 0 | |
| Nonpartisan | 1 | 1 | |
| Total | 8 | 8 | |
Candidates by office
| Office | Incumbent | Assumed Office | Incumbent running? | General Election Candidates | 2015 Winner | Partisan Switch? |
| Governor | Jerry Brown  |
2011 | Yes[3][4] | No | ||
| Lieutenant Governor | Gavin Newsom  |
2011 | Yes[4] | No | ||
| Secretary of State | Debra Bowen  |
2007 | Term-limited | No | ||
| Attorney General | Kamala Harris  |
2011 | Yes[5] | No | ||
| Treasurer | Bill Lockyer  |
2007 | Term-limited | No | ||
| Controller | John Chiang  |
2007 | Term-limited, running for treasurer[6] | No | ||
| Superintendent of Public Instruction | Tom Torlakson  |
2011 | Yes | No | ||
| Commissioner of Insurance | Dave Jones  |
2011 | Yes[7] | No |
Primary election results
Governor
| Governor of California, Blanket Primary, 2014 | ||||
|---|---|---|---|---|
| Party | Candidate | Vote % | Votes | |
| Democratic | 54.3% | 2,354,769 | ||
| Republican | 19.4% | 839,767 | ||
| Republican | Tim Donnelly | 14.8% | 643,236 | |
| Republican | Andrew Blount | 2.1% | 89,749 | |
| Republican | Glenn Champ | 1.8% | 76,066 | |
| Green | Luis Rodriguez | 1.5% | 66,876 | |
| Peace and Freedom | Cindy L. Sheehan | 1.2% | 52,707 | |
| Republican | Alma Marie Winston | 1.1% | 46,042 | |
| Nonpartisan | Robert Newman | 1% | 44,120 | |
| Democratic | Akinyemi Agbede | 0.9% | 37,024 | |
| Republican | Richard Aguirre | 0.8% | 35,125 | |
| Nonpartisan | "Bo" Bogdan Ambrozewicz | 0.3% | 14,929 | |
| Nonpartisan | Janel Hyeshia Buycks | 0.3% | 12,136 | |
| Nonpartisan | Rakesh Kumar Christian | 0.3% | 11,142 | |
| Nonpartisan | Joe Leicht | 0.2% | 9,307 | |
| Total Votes | 4,332,995 | |||
| Election results California Secretary of State | ||||
Lieutenant Governor
| Lieutenant Governor of California, Blanket Primary, 2014 | ||||
|---|---|---|---|---|
| Party | Candidate | Vote % | Votes | |
| Democratic | 49.9% | 2,082,902 | ||
| Republican | 23.4% | 976,128 | ||
| Republican | David Fennell | 8.6% | 357,242 | |
| Republican | George Yang | 8% | 333,857 | |
| Democratic | Eric Korevaar | 5.6% | 232,596 | |
| Green | Jena Goodman | 2.4% | 98,338 | |
| Americans Elect | Alan Reynolds | 1.3% | 56,027 | |
| Peace and Freedom | Amos Johnson | 0.9% | 39,675 | |
| Total Votes | 4,176,765 | |||
| Election results California Secretary of State | ||||
Attorney General
| Attorney General of California, Blanket Primary, 2014 | ||||
|---|---|---|---|---|
| Party | Candidate | Vote % | Votes | |
| Democratic | 53.2% | 2,177,480 | ||
| Republican | 12.3% | 504,091 | ||
| Republican | Phil Wyman | 11.7% | 479,468 | |
| Republican | David King | 9% | 368,190 | |
| Republican | John Haggerty | 8.2% | 336,433 | |
| Nonpartisan | Orly Taitz | 3.2% | 130,451 | |
| Libertarian | Jonathan Jaech | 2.4% | 99,056 | |
| Total Votes | 4,095,169 | |||
| Election results via California Secretary of State | ||||
Secretary of State
| California Secretary of State, Blanket Primary, 2014 | ||||
|---|---|---|---|---|
| Party | Candidate | Vote % | Votes | |
| Democratic | 30.2% | 1,217,371 | ||
| Republican | 29.7% | 1,194,715 | ||
| Democratic | Leland Yee | 9.4% | 380,361 | |
| Nonpartisan | Dan Schnur | 9.2% | 369,898 | |
| Democratic | Derek Cressman | 7.6% | 306,375 | |
| Republican | Roy Allmond | 6.4% | 256,668 | |
| Democratic | Jeff Drobman | 4.4% | 178,521 | |
| Green | David Curtis | 3% | 121,618 | |
| Total Votes | 4,025,527 | |||
| Election results California Secretary of State | ||||
Treasurer
| California Treasurer, Blanket Primary, 2014 | ||||
|---|---|---|---|---|
| Party | Candidate | Vote % | Votes | |
| Democratic | 55% | 2,250,098 | ||
| Republican | 38.4% | 1,571,532 | ||
| Green | Ellen Brown | 6.6% | 270,388 | |
| Total Votes | 4,092,018 | |||
| Election results via California Secretary of State | ||||
Controller
| California Controller, Blanket Primary, 2014 | ||||
|---|---|---|---|---|
| Party | Candidate | Vote % | Votes | |
| Republican | 24.8% | 1,001,473 | ||
| Democratic | 21.7% | 878,195 | ||
| Democratic | John Perez | 21.7% | 877,714 | |
| Republican | David Evans | 21% | 850,109 | |
| Green | Laura Wells | 5.7% | 231,352 | |
| Democratic | Tammy D. Blair | 5% | 200,532 | |
| Total Votes | 4,039,375 | |||
| Election results via California Secretary of State | ||||
Superintendent of Public Instruction
| California Superintendent of Public Instruction, Blanket Primary, 2014 | ||||
|---|---|---|---|---|
| Party | Candidate | Vote % | Votes | |
| Nonpartisan | 46.5% | 1,767,257 | ||
| Nonpartisan | 28.9% | 1,098,441 | ||
| Nonpartisan | Lydia Gutierrez | 24.5% | 931,719 | |
| Total Votes | 3,797,417 | |||
| Election results via California Secretary of State | ||||
Insurance Commissioner
| California Insurance Commissioner, Blanket Primary, 2014 | ||||
|---|---|---|---|---|
| Party | Candidate | Vote % | Votes | |
| Democratic | 53.1% | 2,106,671 | ||
| Republican | 41.6% | 1,651,242 | ||
| Peace and Freedom | Nathalie Hrizi | 5.4% | 212,991 | |
| Total Votes | 3,970,904 | |||
| Election results California Secretary of State | ||||
General election results
The general election took place on November 4, 2014.
Governor
| Governor of California, 2014 | ||||
|---|---|---|---|---|
| Party | Candidate | Vote % | Votes | |
| Democratic | 60% | 4,388,368 | ||
| Republican | Neel Kashkari | 40% | 2,929,213 | |
| Total Votes | 7,317,581 | |||
| Election results California Secretary of State, "Official election results," accessed April 6, 2017 | ||||
Lieutenant Governor
| Lieutenant Governor of California, 2014 | ||||
|---|---|---|---|---|
| Party | Candidate | Vote % | Votes | |
| Democratic | 57.2% | 4,107,051 | ||
| Republican | Ron Nehring | 42.8% | 3,078,039 | |
| Total Votes | 7,185,090 | |||
| Election results via California Secretary of State | ||||
Attorney General
| Attorney General of California, 2014 | ||||
|---|---|---|---|---|
| Party | Candidate | Vote % | Votes | |
| Democratic | 57.5% | 4,102,649 | ||
| Republican | Ronald Gold | 42.5% | 3,033,476 | |
| Total Votes | 7,136,125 | |||
| Election results via California Secretary of State | ||||
Secretary of State
| Secretary of State of California, 2014 | ||||
|---|---|---|---|---|
| Party | Candidate | Vote % | Votes | |
| Democratic | 53.6% | 3,799,711 | ||
| Republican | Pete Peterson | 46.4% | 3,285,334 | |
| Total Votes | 7,085,045 | |||
| Election results via California Secretary of State | ||||
Treasurer
| Treasurer of California, 2014 | ||||
|---|---|---|---|---|
| Party | Candidate | Vote % | Votes | |
| Democratic | 58.8% | 4,176,793 | ||
| Republican | Greg Conlon | 41.2% | 2,925,895 | |
| Total Votes | 7,102,688 | |||
| Election results via California Secretary of State | ||||
Controller
| California Controller, 2014 | ||||
|---|---|---|---|---|
| Party | Candidate | Vote % | Votes | |
| Democratic | 54% | 3,810,304 | ||
| Republican | Ashley Swearengin | 46% | 3,249,668 | |
| Total Votes | 7,059,972 | |||
| Election results via California Secretary of State | ||||
Superintendent of Public Instruction
| Superintendent of California, 2014 | ||||
|---|---|---|---|---|
| Party | Candidate | Vote % | Votes | |
| Nonpartisan | 52.1% | 3,167,212 | ||
| Nonpartisan | Marshall Tuck | 47.9% | 2,906,989 | |
| Total Votes | 6,074,201 | |||
| Election results via California Secretary of State | ||||
Insurance Commissioner
| Insurance Commissioner of California, 2014 | ||||
|---|---|---|---|---|
| Party | Candidate | Vote % | Votes | |
| Democratic | 57.5% | 4,038,165 | ||
| Republican | Ted Gaines | 42.5% | 2,981,951 | |
| Total Votes | 7,020,116 | |||
| Election results via California Secretary of State | ||||
Voter turnout
Political scientist Michael McDonald's United States Elections Project studied voter turnout in the 2014 election by looking at the percentage of eligible voters who headed to the polls. McDonald used voting-eligible population (VEP), or the number of eligible voters independent of their current registration status, to calculate turnout rates in each state on November 4. He also incorporated ballots cast for the highest office in each state into his calculation. He estimated that 81,687,059 ballots were cast in the 50 states plus the District of Columbia, representing 35.9 percent of the VEP.[8] By comparison, 61.6 percent of VEP voted in the 2008 presidential election and 58.2 percent of VEP voted in the 2012 presidential election.[9]
Quick facts
- According to PBS Newshour, voter turnout in the 2014 midterms was the lowest since the 1942 midterms, which took place during the nation's involvement in World War II.[10]
- Forty-three states and the District of Columbia did not surpass 50 percent turnout in McDonald's analysis.
- The three states with the lowest turnout according to McDonald's analysis were Texas (28.3 percent), Tennessee (28.6 percent), and Indiana (28.8 percent).
- Maine (58.5 percent), Wisconsin (56.5 percent), and Colorado (54.5 percent) were the three states with the highest turnout.
- Twelve states increased voter turnout in 2014 compared to the 2010 midterm elections.[11]
| Voter turnout rates, 2014 | |||||
|---|---|---|---|---|---|
| State | Total votes counted | % voter eligible population | Top statewide office up for election | Size of lead (Raw votes) | Size of lead (%) |
| Alabama | 1,191,274 | 33.2 | Governor | 320,319 | 27.2 |
| Alaska | 285,431 | 54.4 | Governor | 4,004 | 1.6 |
| Arizona | 1,537,671 | 34.1 | Governor | 143,951 | 12.5 |
| Arkansas | 852,642 | 40.1 | Governor | 118,664 | 14.0 |
| California | 7,513,972 | 30.8 | Governor | 1,065,748 | 17.8 |
| Colorado | 2,080,071 | 54.5 | Governor | 50,395 | 2.4 |
| Connecticut | 1,096,509 | 42.5 | Governor | 26,603 | 2.5 |
| Delaware | 234,038 | 34.4 | Attorney General | 31,155 | 13.6 |
| District of Columbia | 177,176 | 35.8 | Mayor | 27,934 | 19.0 |
| Florida | 6,026,802 | 43.3 | Governor | 66,127 | 1.1 |
| Georgia | 2,596,947 | 38.5 | Governor | 202,685 | 8.0 |
| Hawaii | 369,554 | 36.5 | Governor | 45,323 | 12.4 |
| Idaho | 445,307 | 39.6 | Governor | 65,852 | 14.9 |
| Illinois | 3,680,417 | 40.9 | Governor | 171,900 | 4.9 |
| Indiana | 1,387,622 | 28.8 | Secretary of State | 234,978 | 17.8 |
| Iowa | 1,142,284 | 50.2 | Governor | 245,548 | 21.8 |
| Kansas | 887,023 | 43.4 | Governor | 33,052 | 3.9 |
| Kentucky | 1,435,868 | 44.0 | U.S. Senate | 222,096 | 15.5 |
| Louisiana | 1,472,039 | 43.8 | U.S. Senate | 16,401 | 1.1 |
| Maine | 616,996 | 58.5 | Governor | 29,820 | 4.9 |
| Maryland | 1,733,177 | 41.5 | Governor | 88,648 | 6.1 |
| Massachusetts | 2,186,789 | 44.6 | Governor | 40,361 | 1.9 |
| Michigan | 3,188,956 | 43.2 | Governor | 129,547 | 4.3 |
| Minnesota | 1,992,613 | 50.5 | Governor | 109,776 | 5.6 |
| Mississippi | 631,858 | 28.9 | U.S. Senate | 141,234 | 33.0 |
| Missouri | 1,426,303 | 31.8 | Auditor | 684,074 | 53.6 |
| Montana | 373,831 | 47.3 | U.S. Senate | 65,262 | 17.9 |
| Nebraska | 552,115 | 41.5 | Governor | 97,678 | 18.7 |
| Nevada | 547,349 | 29.0 | Governor | 255,793 | 46.7 |
| New Hampshire | 495,565 | 48.4 | Governor | 24,924 | 5.2 |
| New Jersey | 1,955,042 | 32.5 | N/A | N/A | N/A |
| New Mexico | 512,805 | 35.7 | Governor | 73,868 | 14.6 |
| New York | 3,930,310 | 29.0 | Governor | 476,252 | 13.4 |
| North Carolina | 2,939,767 | 41.2 | U.S. Senate | 48,511 | 1.7 |
| North Dakota | 255,128 | 45.0 | U.S. House At-large seat | 42,214 | 17.1 |
| Ohio | 3,149,876 | 36.2 | Governor | 933,235 | 30.9 |
| Oklahoma | 824,831 | 29.8 | Governor | 122,060 | 14.7 |
| Oregon | 1,541,782 | 53.5 | Governor | 59,029 | 4.5 |
| Pennsylvania | 3,495,866 | 36.0 | Governor | 339,261 | 9.8 |
| Rhode Island | 329,212 | 42.2 | Governor | 14,346 | 4.5 |
| South Carolina | 1,261,611 | 35.2 | Governor | 179,089 | 14.6 |
| South Dakota | 282,291 | 44.9 | Governor | 124,865 | 45.1 |
| Tennessee | 1,374,065 | 28.6 | Governor | 642,214 | 47.5 |
| Texas | 4,727,208 | 28.3 | Governor | 957,973 | 20.4 |
| Utah | 577,973 | 30.2 | Attorney General | 173,819 | 35.2 |
| Vermont | 193,087 | 38.8 | Governor | 2,095 | 1.1 |
| Virginia | 2,194,346 | 36.6 | U.S. Senate | 16,727 | 0.8 |
| Washington | 2,123,901 | 43.1 | N/A | N/A | N/A |
| West Virginia | 451,498 | 31.2 | U.S. Senate | 124,667 | 27.6 |
| Wisconsin | 2,410,314 | 56.5 | Governor | 137,607 | 5.7 |
| Wyoming | 168,390 | 39.3 | Governor | 52,703 | 33.6 |
Note: Information from the United States Elections Project was last updated on December 16, 2014.
Key deadlines
| Deadline | Event |
|---|---|
| February 20, 2014 | Deadline for candidates to file signatures in lieu of a filing fee |
| March 7, 2014 | Candidate filing deadline if paying fee for ballot access |
| June 3, 2014 | Primary election |
| November 4, 2014 | General election |
| November 6-December 2, 2014 | State Canvassing Board meeting to certify election results |
| January 5, 2015 | Inauguration day for state executive officials in general election |
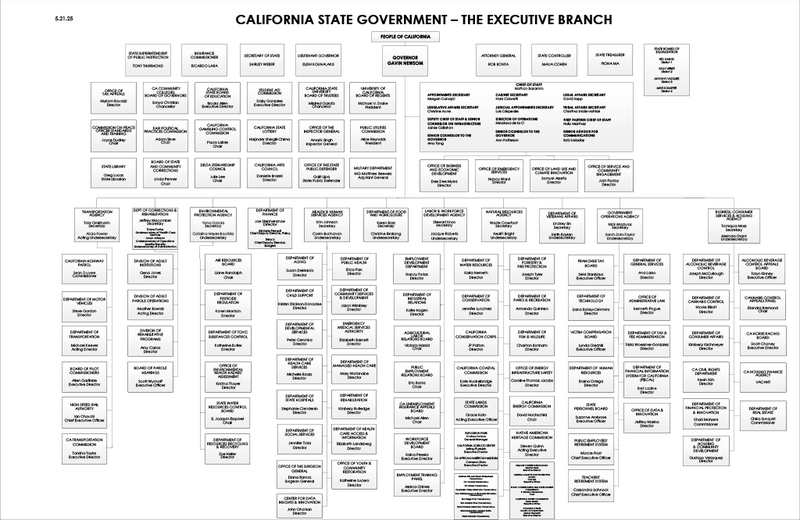
State executive organization
Executive officials in California are part of a three-pronged government structure that includes state legislators and state judges. The following chart details the relationship among different branches of California's state government:
Ballotpedia reports
To learn more about developments in these races, check out the following news articles from Ballotpedia:
- Neel Kashkari to face Jerry Brown in November: California state executive primary elections review
- Primary preview: California state executive elections, 2014
Recent news
This section links to a Google news search for the term "California + State + Executive +-Obama + Elections"
See also

Footnotes
- ↑ National Conference of State Legislatures, "State Primary Election Types," accessed August 13, 2024
- ↑ California Secretary of State, "Primary Elections in California," accessed August 13, 2024
- ↑ Los Angeles Times, "Gov. Jerry Brown announces re-election bid," February 27, 2014
- ↑ 4.0 4.1 California Secretary of State, "Campaign Finance:Statement of Intention," accessed September 12, 2013
- ↑ California Secretary of State, "HARRIS 2014; RE-ELECT ATTORNEY GENERAL KAMALA," accessed September 12, 2013
- ↑ John Chiang for State Treasurer 2014 Official Campaign Website, "Homepage," accessed September 12, 2013
- ↑ The Sacramento Bee, "California's insurance commissioner seeks re-election, more power," December 22, 2013
- ↑ United States Elections Project, "2014 November General Election Turnout Rates," November 7, 2014
- ↑ TIME, "Voter Turnout in Midterm Elections Hits 72-Year Low," November 10, 2014
- ↑ PBS, "2014 midterm election turnout lowest in 70 years," November 10, 2014
- ↑ U.S. News & World Report, "Midterm Turnout Down in 2014," November 5, 2014
