Your feedback ensures we stay focused on the facts that matter to you most—take our survey.
Delaware state executive official elections, 2014
| Delaware's 2014 elections U.S. Senate • U.S. House • Attorney General • Other executive offices • State Senate • State House • School boards • Candidate ballot access |
2015 →
← 2013
|
| 2014 State Executive Official Elections |
| Alabama • Alaska • Arizona • Arkansas • California • Colorado • Connecticut • Delaware • Florida • Georgia • Hawaii • Idaho • Illinois • Indiana • Iowa • Kansas • Louisiana • Maine • Maryland • Massachusetts • Michigan • Minnesota • Missouri • Montana • Nebraska • Nevada • New Hampshire • New Mexico • New York • North Dakota • Ohio • Oklahoma • Oregon • Pennsylvania • Rhode Island • South Carolina • South Dakota • Tennessee • Texas • Utah • Vermont • Wisconsin • Wyoming |
| Partisan breakdown Candidates by office Voter turnout Key deadlines State executive organization Ballotpedia reports Recent news See also |
| News • Calendar |
Three state executive positions were up for election in 2014 in the state of Delaware. The general election took place on November 4, 2014, following a primary on September 9.
A primary election is an election in which registered voters select a candidate that they believe should be a political party's candidate for elected office to run in the general election. They are also used to choose convention delegates and party leaders. Primaries are state-level and local-level elections that take place prior to a general election. Delaware utilizes a closed primary process, in which the selection of a party's candidates in an election is limited to registered party members.[1][2][3]
For information about which offices are nominated via primary election, see this article.
The following offices were elected in 2014 in Delaware:
In addition to candidate lists and election results, this page includes information about important dates, how the state's executive branch is organized, as well as links to articles about recent news in races across the state.
Partisan breakdown
Heading into the November 4 election, the Democratic Party held two of the three state executive seats up for election in 2014 in Delaware.
| Delaware State Executives -- Partisan Breakdown | |||
|---|---|---|---|
| Party | As of November 4, 2014 | After the 2014 Election | |
| Democratic Party | 2 | 1 | |
| Republican Party | 1 | 2 | |
| Total | 3 | 3 | |
Candidates by office
| Office | Incumbent | Assumed Office | Incumbent running? | General Election Candidates | 2015 Winner | Partisan Switch? |
| Attorney General | Beau Biden |
2007 | No[4] | No | ||
| Treasurer | Chip Flowers  |
2011 | No[5] | Yes | ||
| State Auditor | R. Thomas Wagner, Jr.  |
1989 | Yes[6] | No |
Primary results
Delaware Attorney General
- Republican primary - Uncontested
- Democratic primary - Uncontested
Delaware Treasurer
- Republican primary
| Delaware Treasurer, Republican Primary, 2014 | ||||
|---|---|---|---|---|
| Candidate | Vote % | Votes | ||
| 53.9% | 13,491 | |||
| Sher Valenzuela | 46.1% | 11,549 | ||
| Total Votes | 25,040 | |||
| Election results via Office of the Delaware Elections Commissioner. | ||||
- Democratic primary - Uncontested
Delaware Auditor
- Democratic primary
| Delaware Auditor, Democratic Primary, 2014 | ||||
|---|---|---|---|---|
| Candidate | Vote % | Votes | ||
| 55% | 12,091 | |||
| Ken Matlusky | 45% | 9,896 | ||
| Total Votes | 21,987 | |||
| Election results via Office of the Delaware Elections Commissioner. | ||||
- Republican primary - Uncontested
General election results
The general election took place on November 4, 2014.
Delaware Attorney General
| Attorney General of Delaware, 2014 | ||||
|---|---|---|---|---|
| Party | Candidate | Vote % | Votes | |
| Democratic | 52.8% | 121,410 | ||
| Republican | Ted Kittila | 39.2% | 90,257 | |
| Green | Catherine Damavandi | 4.6% | 10,599 | |
| Independent | David Graham | 2.1% | 4,879 | |
| Libertarian | John Machurek | 1.3% | 2,984 | |
| Total Votes | 230,129 | |||
| Election results via Delaware Office of the State Election Commissioner | ||||
Delaware Treasurer
| Delaware Treasurer, 2014 | ||||
|---|---|---|---|---|
| Party | Candidate | Vote % | Votes | |
| Republican | 53.6% | 123,105 | ||
| Democratic | Sean Barney | 43.6% | 100,218 | |
| Green | David Chandler | 2.8% | 6,373 | |
| Total Votes | 229,696 | |||
| Election results via Delaware Office of the State Election Commissioner | ||||
Delaware Auditor
| Delaware Auditor, 2014 | ||||
|---|---|---|---|---|
| Party | Candidate | Vote % | Votes | |
| Republican | 54.2% | 123,100 | ||
| Democratic | Brenda Mayrack | 45.8% | 103,939 | |
| Total Votes | 227,039 | |||
| Election results via Delaware Office of the State Election Commissioner | ||||
Voter turnout
Political scientist Michael McDonald's United States Elections Project studied voter turnout in the 2014 election by looking at the percentage of eligible voters who headed to the polls. McDonald used voting-eligible population (VEP), or the number of eligible voters independent of their current registration status, to calculate turnout rates in each state on November 4. He also incorporated ballots cast for the highest office in each state into his calculation. He estimated that 81,687,059 ballots were cast in the 50 states plus the District of Columbia, representing 35.9 percent of the VEP.[7] By comparison, 61.6 percent of VEP voted in the 2008 presidential election and 58.2 percent of VEP voted in the 2012 presidential election.[8]
Quick facts
- According to PBS Newshour, voter turnout in the 2014 midterms was the lowest since the 1942 midterms, which took place during the nation's involvement in World War II.[9]
- Forty-three states and the District of Columbia did not surpass 50 percent turnout in McDonald's analysis.
- The three states with the lowest turnout according to McDonald's analysis were Texas (28.3 percent), Tennessee (28.6 percent), and Indiana (28.8 percent).
- Maine (58.5 percent), Wisconsin (56.5 percent), and Colorado (54.5 percent) were the three states with the highest turnout.
- Twelve states increased voter turnout in 2014 compared to the 2010 midterm elections.[10]
| Voter turnout rates, 2014 | |||||
|---|---|---|---|---|---|
| State | Total votes counted | % voter eligible population | Top statewide office up for election | Size of lead (Raw votes) | Size of lead (%) |
| Alabama | 1,191,274 | 33.2 | Governor | 320,319 | 27.2 |
| Alaska | 285,431 | 54.4 | Governor | 4,004 | 1.6 |
| Arizona | 1,537,671 | 34.1 | Governor | 143,951 | 12.5 |
| Arkansas | 852,642 | 40.1 | Governor | 118,664 | 14.0 |
| California | 7,513,972 | 30.8 | Governor | 1,065,748 | 17.8 |
| Colorado | 2,080,071 | 54.5 | Governor | 50,395 | 2.4 |
| Connecticut | 1,096,509 | 42.5 | Governor | 26,603 | 2.5 |
| Delaware | 234,038 | 34.4 | Attorney General | 31,155 | 13.6 |
| District of Columbia | 177,176 | 35.8 | Mayor | 27,934 | 19.0 |
| Florida | 6,026,802 | 43.3 | Governor | 66,127 | 1.1 |
| Georgia | 2,596,947 | 38.5 | Governor | 202,685 | 8.0 |
| Hawaii | 369,554 | 36.5 | Governor | 45,323 | 12.4 |
| Idaho | 445,307 | 39.6 | Governor | 65,852 | 14.9 |
| Illinois | 3,680,417 | 40.9 | Governor | 171,900 | 4.9 |
| Indiana | 1,387,622 | 28.8 | Secretary of State | 234,978 | 17.8 |
| Iowa | 1,142,284 | 50.2 | Governor | 245,548 | 21.8 |
| Kansas | 887,023 | 43.4 | Governor | 33,052 | 3.9 |
| Kentucky | 1,435,868 | 44.0 | U.S. Senate | 222,096 | 15.5 |
| Louisiana | 1,472,039 | 43.8 | U.S. Senate | 16,401 | 1.1 |
| Maine | 616,996 | 58.5 | Governor | 29,820 | 4.9 |
| Maryland | 1,733,177 | 41.5 | Governor | 88,648 | 6.1 |
| Massachusetts | 2,186,789 | 44.6 | Governor | 40,361 | 1.9 |
| Michigan | 3,188,956 | 43.2 | Governor | 129,547 | 4.3 |
| Minnesota | 1,992,613 | 50.5 | Governor | 109,776 | 5.6 |
| Mississippi | 631,858 | 28.9 | U.S. Senate | 141,234 | 33.0 |
| Missouri | 1,426,303 | 31.8 | Auditor | 684,074 | 53.6 |
| Montana | 373,831 | 47.3 | U.S. Senate | 65,262 | 17.9 |
| Nebraska | 552,115 | 41.5 | Governor | 97,678 | 18.7 |
| Nevada | 547,349 | 29.0 | Governor | 255,793 | 46.7 |
| New Hampshire | 495,565 | 48.4 | Governor | 24,924 | 5.2 |
| New Jersey | 1,955,042 | 32.5 | N/A | N/A | N/A |
| New Mexico | 512,805 | 35.7 | Governor | 73,868 | 14.6 |
| New York | 3,930,310 | 29.0 | Governor | 476,252 | 13.4 |
| North Carolina | 2,939,767 | 41.2 | U.S. Senate | 48,511 | 1.7 |
| North Dakota | 255,128 | 45.0 | U.S. House At-large seat | 42,214 | 17.1 |
| Ohio | 3,149,876 | 36.2 | Governor | 933,235 | 30.9 |
| Oklahoma | 824,831 | 29.8 | Governor | 122,060 | 14.7 |
| Oregon | 1,541,782 | 53.5 | Governor | 59,029 | 4.5 |
| Pennsylvania | 3,495,866 | 36.0 | Governor | 339,261 | 9.8 |
| Rhode Island | 329,212 | 42.2 | Governor | 14,346 | 4.5 |
| South Carolina | 1,261,611 | 35.2 | Governor | 179,089 | 14.6 |
| South Dakota | 282,291 | 44.9 | Governor | 124,865 | 45.1 |
| Tennessee | 1,374,065 | 28.6 | Governor | 642,214 | 47.5 |
| Texas | 4,727,208 | 28.3 | Governor | 957,973 | 20.4 |
| Utah | 577,973 | 30.2 | Attorney General | 173,819 | 35.2 |
| Vermont | 193,087 | 38.8 | Governor | 2,095 | 1.1 |
| Virginia | 2,194,346 | 36.6 | U.S. Senate | 16,727 | 0.8 |
| Washington | 2,123,901 | 43.1 | N/A | N/A | N/A |
| West Virginia | 451,498 | 31.2 | U.S. Senate | 124,667 | 27.6 |
| Wisconsin | 2,410,314 | 56.5 | Governor | 137,607 | 5.7 |
| Wyoming | 168,390 | 39.3 | Governor | 52,703 | 33.6 |
Note: Information from the United States Elections Project was last updated on December 16, 2014.
Key deadlines
| Deadline | Event |
|---|---|
| July 8, 2014 | Filing deadline (Democratic and Republican) |
| July 15, 2014 | Filing deadline (Other candidates) |
| September 9, 2014 | Primary election |
| November 4, 2014 | General election |
| November 6, 2014 | State Board of Canvass meets in Superior Court |
| January 6, 2015 | Inauguration day for state executive officials in general election |
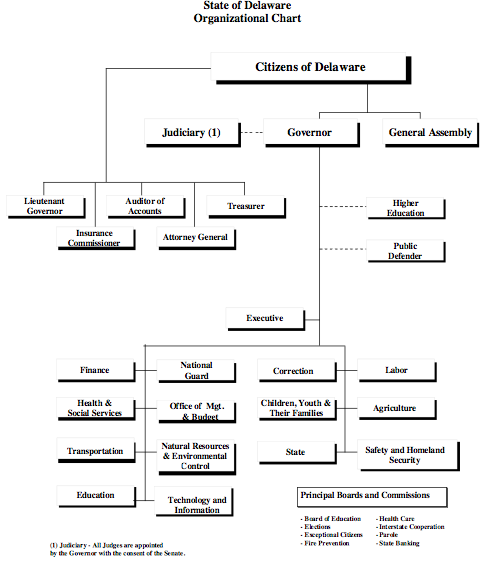
State executive organization
Executive officials in Delaware are part of a three-pronged government structure that includes state legislators and state judges. The following chart details the relationship among different branches of Delaware's state government:
Ballotpedia reports
To learn more about developments in these races, check out the following news articles from Ballotpedia:
- Simpler, Mayrack advance in down ballot races: Delaware state executive primary elections review
- Delaware filing deadline report: 10 candidates file for 3 state executive positions
Recent news
This section links to a Google news search for the term "Delaware + State + Executive +-Obama + Elections"
See also

Footnotes
- ↑ National Conference of State Legislatures, "State Primary Election Types," accessed July 22, 2024
- ↑ State of Delaware, "Primary Election," accessed July 22, 2024
- ↑ Delaware.gov, "TITLE 15 Elections, CHAPTER 49. Conduct of Election § 3110 Qualifications of voters," accessed July 22, 2024
- ↑ Beau Biden for Attorney General official website, "Splash page," accessed April 18, 2014
- ↑ Delaware.newszap.com, "UPDATE: Delaware treasurer Flowers not running for re-election," August 16, 2014
- ↑ Tom Wagner for Auditor 2014 Official campaign website, "Homepage," accessed July 15, 2014
- ↑ United States Elections Project, "2014 November General Election Turnout Rates," November 7, 2014
- ↑ TIME, "Voter Turnout in Midterm Elections Hits 72-Year Low," November 10, 2014
- ↑ PBS, "2014 midterm election turnout lowest in 70 years," November 10, 2014
- ↑ U.S. News & World Report, "Midterm Turnout Down in 2014," November 5, 2014
