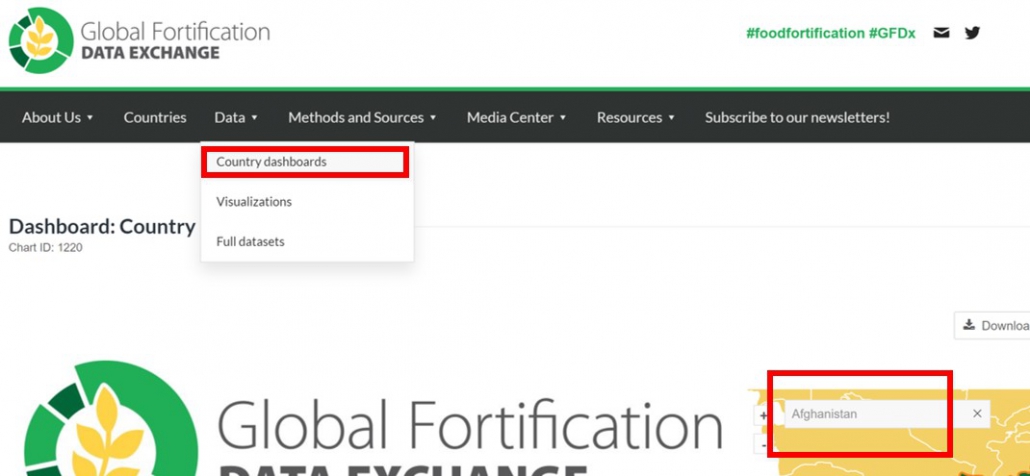
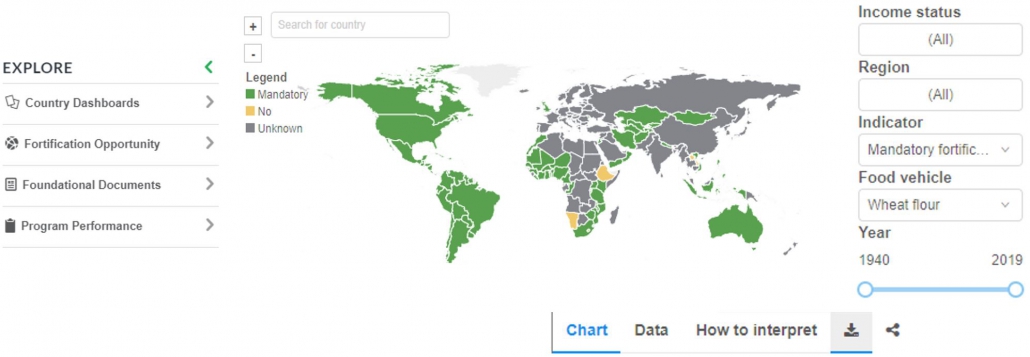
See more…
-
Chart: Total Food Availability
Chart showing total annual food supply available for human consumption by country (Use this chart to identify total annual food availability of maize flour, oil, salt, rice, or wheat flour in a country)
Chart: Quantity and Proportion of Industrially Processed Food Vehicles
Chart showing the total quantity and proportion of each food vehicle that is industrially processed by country
-
Chart: Quantity and Proportion of Industrially Processed Foods by Year
Chart displaying the total quantity and proportion of each industrially processed food vehicle in a country by year
Map: Presence of external and import monitoring protocols
Whether countries with mandatory fortification legislation have the applicable protocols to monitor the domestic production (external monitoring) or importation (import monitoring) of fortified foods. The presence of a monitoring protocol indicates that a country has identified procedures to carry out external and/or import monitoring of food fortification. If a country lacks an external and/or import monitoring protocol, it would suggest that a basic foundational document for the implementation of food fortification programs is missing.
-
Map: Food Intake and Availability
Map counting the number of nutrients required in food vehicles by country (Use this map to identify by country how many nutrients are required in mandatory or voluntary standards for maize flour, oil, salt, rice, and/or wheat flour)
-
Chart: Year When Food Fortification Mandated
Chart of the number of countries with mandatory food fortification over time (Use this chart to identify when a country first passed mandatory fortification of maize flour, oil, salt, rice, and/or wheat flour)
Plot: Fortification Legislation Scope in Countries with Mandatory Fortification
Plot displaying the scope of fortification legislation, which includes information on whether all food vehicle types or a subset are required to be fortified and whether mandatory legislation requires food vehicles of different origins/destinations and intended uses to be fortified
-
Map: Number of Food Vehicles with Standards
Map counting the number of food vehicles with fortification standards by country (Use this map to identify by country how many of the following foods have mandatory or voluntary standards: maize flour, oil, salt, rice, and/or wheat flour)
Map: Count of Nutrients in Standards
Map counting the number of nutrients required in food vehicles by country (Use this map to identify by country how many nutrients are required in mandatory or voluntary standards for maize flour, oil, salt, rice, and/or wheat flour)
-
Map: Availability of Data on Health Status Before and After Mandatory Fortification
The purpose of mandatory food fortification is to improve health outcomes in a population. Health improvements can be measured in changes in blood biomarkers and/or changes in functional outcomes that are caused by a deficiency in a nutrient. This visualization presents the number of countries that have data or studies comparing health status before and after mandatory fortification.
GFDx Analysis: Alignment of national fortification standards with WHO guidelines (nutrient compounds)
Nutrients can be added in fortification as different chemical forms (compounds). This visualization compares the nutrient compounds specified in national fortification standards to those recommended in WHO guidelines.
GFDx Analysis: Comparison of national fortification standards with WHO guidelines (nutrient levels)
Nutrient amounts (or levels) added in fortification should contribute meaningfully to dietary intake. This visualization compares nutrient levels specified in national fortification standards to those recommended in WHO guidelines. Results from this analysis should be used as a starting point for policymakers to discuss whether national fortification requirements are as safe and effective as possible.
-
GFDx Analysis: Potential nutrient intake under ideal (unadjusted) and real-life (adjusted for program implementation data, where available) scenarios
This visualization calculates the potential intake of nutrients included in fortification standards based on food intake/availability information. Data is presented under the ideal scenario that all food can and has been fortified, as well as real-life scenario that adjusts data for the proportion of food that can be fortified (i.e., is industrially milled) and the proportion of food that has been fortified (i.e., compliance, quality, or expert opinion data), if this data is available.


