- >>Weather by month // weather averages Benidorm
- >>Climate graph // Weather by Month Benidorm
- >>average temperature by month Benidorm
- >>Weather Benidorm
- >>Water temperature Benidorm
The given location is in the northern hemisphere. -> The particular spot is situated in the upper half of the planet. Summer begins at the end of June and ends in September. The months of summer are: June, July, August, September. It is recommended that the optimal period for embarking on a journey would be during July, August, September.
The Benidorm is the Capital of
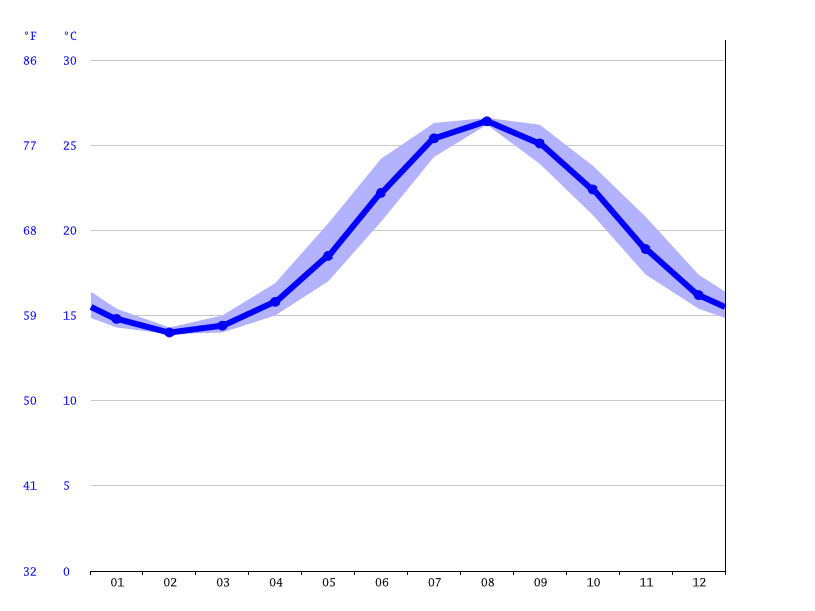
Climate graph // Weather by Month Benidorm

In July, the precipitation level plummets to a mere 5 mm | 0.2 inch. This month holds the title for being exceptionally arid. In October, the precipitation reaches its peak, with an average of 54 mm | 2.1 inch.
average temperature by month Benidorm

The month of highest temperature is August during which the average temperature reaches up to 25.4 °C | 77.7 °F. At 9.9 °C | 49.8 °F on average, January is the coldest month of the year.
Weather by month // weather averages Benidorm
| Avg. Temperature °C (°F) | Min. Temperature °C (°F) | Max. Temperature °C (°F) | Precipitation / Rainfall mm (in) | Humidity (%) | Rainy days (d) | avg. Sun hours (hours) | |
|---|---|---|---|---|---|---|---|
| January |
9.9 (49.8) |
6.3 (43.3) |
14.1 (57.3) |
38 (1.5) |
69% | 4 | 7.0 |
| February |
10.3 (50.5) |
6.4 (43.6) |
14.5 (58.1) |
33 (1.3) |
66% | 4 | 8.0 |
| March |
12.6 (54.6) |
8.3 (47) |
17 (62.6) |
37 (1.5) |
64% | 4 | 9.0 |
| April |
14.9 (58.8) |
10.6 (51.1) |
19.2 (66.6) |
46 (1.8) |
63% | 5 | 10.0 |
| May |
18.2 (64.7) |
13.6 (56.4) |
22.5 (72.5) |
35 (1.4) |
62% | 4 | 12.0 |
| June |
22.6 (72.7) |
17.8 (64) |
27.1 (80.8) |
14 (0.6) |
58% | 2 | 13.0 |
| July |
25.3 (77.5) |
20.7 (69.3) |
29.8 (85.6) |
5 (0.2) |
60% | 2 | 12.0 |
| August |
25.4 (77.7) |
21.3 (70.4) |
29.8 (85.6) |
15 (0.6) |
63% | 3 | 11.0 |
| September |
22.3 (72.1) |
18.7 (65.6) |
26.3 (79.4) |
53 (2.1) |
67% | 6 | 9.0 |
| October |
18.7 (65.6) |
15.2 (59.3) |
22.5 (72.6) |
54 (2.1) |
71% | 5 | 8.0 |
| November |
13.5 (56.3) |
10.2 (50.3) |
17.2 (63) |
49 (1.9) |
69% | 5 | 8.0 |
| December |
10.6 (51.2) |
7.3 (45.2) |
14.5 (58.1) |
39 (1.5) |
72% | 4 | 7.0 |
| January | February | March | April | May | June | July | August | September | October | November | December | |
|---|---|---|---|---|---|---|---|---|---|---|---|---|
| Avg. Temperature °C (°F) |
9.9 °C (49.8) °F |
10.3 °C (50.5) °F |
12.6 °C (54.6) °F |
14.9 °C (58.8) °F |
18.2 °C (64.7) °F |
22.6 °C (72.7) °F |
25.3 °C (77.5) °F |
25.4 °C (77.7) °F |
22.3 °C (72.1) °F |
18.7 °C (65.6) °F |
13.5 °C (56.3) °F |
10.6 °C (51.2) °F |
| Min. Temperature °C (°F) |
6.3 °C (43.3) °F |
6.4 °C (43.6) °F |
8.3 °C (47) °F |
10.6 °C (51.1) °F |
13.6 °C (56.4) °F |
17.8 °C (64) °F |
20.7 °C (69.3) °F |
21.3 °C (70.4) °F |
18.7 °C (65.6) °F |
15.2 °C (59.3) °F |
10.2 °C (50.3) °F |
7.3 °C (45.2) °F |
| Max. Temperature °C (°F) |
14.1 °C (57.3) °F |
14.5 °C (58.1) °F |
17 °C (62.6) °F |
19.2 °C (66.6) °F |
22.5 °C (72.5) °F |
27.1 °C (80.8) °F |
29.8 °C (85.6) °F |
29.8 °C (85.6) °F |
26.3 °C (79.4) °F |
22.5 °C (72.6) °F |
17.2 °C (63) °F |
14.5 °C (58.1) °F |
| Precipitation / Rainfall mm (in) |
38 (1) |
33 (1) |
37 (1) |
46 (1) |
35 (1) |
14 (0) |
5 (0) |
15 (0) |
53 (2) |
54 (2) |
49 (1) |
39 (1) |
| Humidity(%) | 69% | 66% | 64% | 63% | 62% | 58% | 60% | 63% | 67% | 71% | 69% | 72% |
| Rainy days (d) | 4 | 4 | 4 | 5 | 4 | 2 | 1 | 3 | 6 | 6 | 6 | 4 |
| avg. Sun hours (hours) | 7.4 | 7.9 | 9.2 | 10.4 | 11.7 | 12.6 | 12.2 | 11.0 | 9.3 | 8.3 | 7.6 | 7.0 |
Data: 1991 - 2021 Min. Temperature °C (°F), Max. Temperature °C (°F), Precipitation / Rainfall mm (in), Humidity, Rainy days. Data: 1999 - 2019: avg. Sun hours
The precipitation variance between the months with the lowest and highest levels of rainfall is 49 mm | 2 inch. The variation in annual temperature is around 15.5 °C | 27.9 °F.
The month with the most relative humidity is December (72.02 %). The month with the least relative humidity is June (58.07 %). The wettest month is September (7.50 days), while the driest is July (1.63).
Benidorm weather and climate for every month
Hours of sunshine in Benidorm
- avg. hours of sun
- Total hours of sun


The month with the most daily hours of sunshine in Benidorm is June, averaging 12.23 hours of sunshine. In total, there are 379.03 hours of sunshine throughout June.
In Benidorm, the month that experiences the least amount of daily sunshine is January. On average, there are only about 7.03 hours of sunlight per day during this time. The total number of sunlit hours in a typical January amounts to approximately 217.97.
In Benidorm, the yearly sum of sunshine is estimated to be around 3492.3 hours. On average, this equates to a monthly figure of approximately 291.03 hours for each month.
Water temperature Benidorm(Mediterranean Sea)
| Max. Water temperature °C (°F) | Avg. Water Temperature °C (°F) | Min. Water Temperature °C (°F) | |
|---|---|---|---|
| January |
15.4 59.7 |
14.8 58.6 |
14.3 57.7 |
| February |
14.3 57.7 |
14 57.2 |
13.9 57 |
| March |
15 59 |
14.4 57.9 |
14 57.2 |
| April |
16.9 62.4 |
15.8 60.4 |
15 59 |
| May |
20.4 68.7 |
18.5 65.3 |
17 62.6 |
| June |
24.2 75.6 |
22.2 72 |
20.5 68.9 |
| July |
26.3 79.3 |
25.4 77.7 |
24.3 75.7 |
| August |
26.6 79.9 |
26.4 79.5 |
26.2 79.2 |
| September |
26.2 79.2 |
25.1 77.2 |
23.9 75 |
| October |
23.8 74.8 |
22.4 72.3 |
20.9 69.6 |
| November |
20.8 69.4 |
18.9 66 |
17.4 63.3 |
| December |
17.4 63.3 |
16.2 61.2 |
15.4 59.7 |
| January | February | March | April | May | June | July | August | September | October | November | December | |
|---|---|---|---|---|---|---|---|---|---|---|---|---|
| Min. Water Temperature °C (°F) |
14.3 57.7 |
13.9 57 |
14 57.2 |
15 59 |
17 62.6 |
20.5 68.9 |
24.3 75.7 |
26.2 79.2 |
23.9 75 |
20.9 69.6 |
17.4 63.3 |
15.4 59.7 |
| Avg. Water Temperature °C (°F) |
14.8 58.6 |
14 57.2 |
14.4 57.9 |
15.8 60.4 |
18.5 65.3 |
22.2 72 |
25.4 77.7 |
26.4 79.5 |
25.1 77.2 |
22.4 72.3 |
18.9 66 |
16.2 61.2 |
| Max. Water temperature °C (°F) |
15.4 59.7 |
14.3 57.7 |
15 59 |
16.9 62.4 |
20.4 68.7 |
24.2 75.6 |
26.3 79.3 |
26.6 79.9 |
26.2 79.2 |
23.8 74.8 |
20.8 69.4 |
17.4 63.3 |
The average water temperature during the year located in Benidorm (Mediterranean Sea) at 19.50°C | 67.10°F.
At about 26.60°C | 79.88°F is the maximum of the water temperatures over the months. This will be reached in August. The low is 13.90°C | 57.02°F and is measured in February.
The date of the lowest water temperature is around February 16. At this time, it is about 13.90°C | 57.02°F. The maximum of 26.60°C | 79.88°F is measured around August 07.
The nearest water to Benidorm is the Mediterranean Sea.
Airport close to Benidorm
The closest Airports of Benidorm are: Alicante Airport (ALC) 46.76km,Murcia-San Javier Airport (MJV) 104.32km,Valencia Airport (VLC) 109.87km
You can reach Benidorm from this Cities by Plane: London (LTN), Leeds (LBA), Glasgow (PIK), Copenhagen (CPH), Vienna (VIE), Paris (ORY), Birmingham (BHX), Edinburgh (EDI), Exeter (EXT), Hamburg (HAM), Tromsø (TOS), Newcastle upon Tyne (NCL), Cologne (CGN), Oslo (RYG), Bremen (BRE), Bergen (BGO), Liverpool (LPL), Turku (TKU), Nottingham (EMA), Växjö (VXO)