Ballotpedia:Who Runs the States, SQLI, Overall Rankings
Praise or blame is extended to political parties for the economic, educational, health and other quality of life outcomes that result from the policies those parties enact into law. To better understand which political party enjoys power in each of the states, Ballotpedia has analyzed state government control from 1992-2013 using the concept of a "partisan trifecta." A partisan trifecta is defined as when a state's governorship and legislative chambers are controlled by the same political party.
The two major political parties claim that their policies will lead to better outcomes. What does the data show?
At Ballotpedia, we explored these issues in a three-part study, Who Runs the States.
This page contains the section of Part Two pertaining to the Overall Rankings.
Overall Rankings
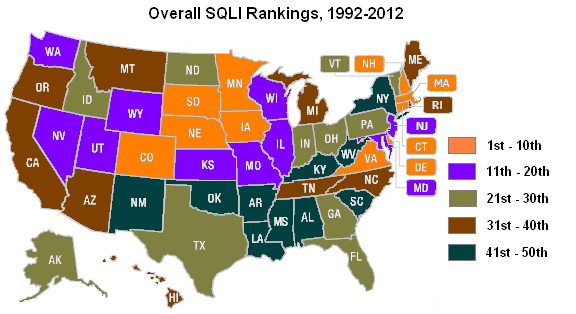
As stated above, we wanted to quantify all of the indices we included and identify the state that performed best across the entire 21-year period. We took each state's average ranking for each year and then created one aggregate rank for the whole study. New Hampshire ranked 1st overall in our quality-of-life index. The Granite State took the top spot for 14 of the 21 years in our study, coming in 1st from 1994 through 1996, from 1998 to 2005, and again in 2008. The state never ranked lower than 7th in any individual year. Ranking 1st in only 2010 and 2011, Minnesota took runner-up honors and was never ranked lower than 5th. The remainder of the top 10: Colorado, 3rd; Nebraska, 4th; Iowa, 5th; Connecticut, 6th; Virginia, 7th; South Dakota, 8th; Massachusetts, 9th; and Delaware, 10th.
At the other end of the spectrum, Mississippi ranked last in our quality-of-life index, finishing 50th from 1993 to 1998, from 2001 to 2005, and again from 2009 to 2012. The Magnolia State was ranked 49th, its best position, for the remaining six years. West Virginia was the second-to-last state overall and actually finished last from 2006 to 2008. West Virginia's 48th position in 1992 and again from 1995 to 2000 marked its highest annual finishes. The other members of the bottom 10 were New Mexico, 48th; Kentucky 47th; Louisiana, 46th; South Carolina, 45th; Arkansas, 44th; Alabama, 43rd; New York, 42nd; and Oklahoma, 41st. On average, each state shifted 2.6 positions (up or down) annually from its ranking the previous year. States shifted the most from 2004 to 2005 with each state shifting up or down an average of 3.7 positions. North Dakota's ranking fluctuated the most in our quality-of-life index, shifting an average of 4.7 positions annually. Mississippi and West Virginia were the most consistent states. These two states' rankings each moved only five total positions, an average of 0.25 each year. As portrayed in the figure above, the southeast had a high concentration of states that finished in the bottom portion of the rankings. On the other hand, a grouping of states in the northern midwest finished in the top tier of states.
Texas's SQLI ranking experienced the most net improvement from 1992 to 2012, moving up 1.25 spots each year on average. Buoyed by the inclusion of business ranking such as Forbes Best States for Business in the SQLI for the recent years, Texas jumped from 36th place in 1992 to 11th in 2012, tied with 2007 for its top annual ranking. Nevada saw the largest drop in ranking, plummeting 34 spots (1.7 annually) from 12th in 1992 to 46th in 2012. Nevada had been as high as 7th in 2006 before the U.S. housing market collapsed. Most of Nevada's fall took place in the final five years of the study as the recession hit the state's economy especially hard and other indicators, such as its graduation rate, also worsened. Among states which saw the smallest net change in their rankings, Kentucky and Missouri improved by only one position, while Arkansas, Massachusetts, Mississippi, and West Virginia each moved back one spot. Connecticut had the greatest one-year drop, falling 14 spots from 19th in 2011 to 33rd in 2012. Connecticut's scores in Wall Street's Best/ Worst States and its Graduation Rate were the areas where it experienced the most significant drops in rankings, dropping more than 10 places in each index going from 2011 to 2012. Arizona, Texas, Washington, and Wyoming tied for the greatest one-year improvement, all jumping up 13 spots. Arizona moved from 30th in 2004 to 17th in 2005, Texas advanced from 33rd in 2004 to 20th in 2005, Washington improved from 29th in 2005 to 16th in 2006, and Wyoming leapt from 24th in 2007 to 11th in 2008.
See also
- Ballotpedia:Who runs the states
- Ballotpedia:Who Runs the States, Part One: State Partisanship
- Ballotpedia:Who Runs the States, Part Two: State Quality of life Index (SQLI)
- Part 1 Full report PDF
- Part 2 Full report PDF
- State government trifectas