Pivot Counties in Michigan
| 2020 Election Analysis: Pivot Counties |
|---|
Retained • Boomerang Margins of victory Voter turnout Demographics |
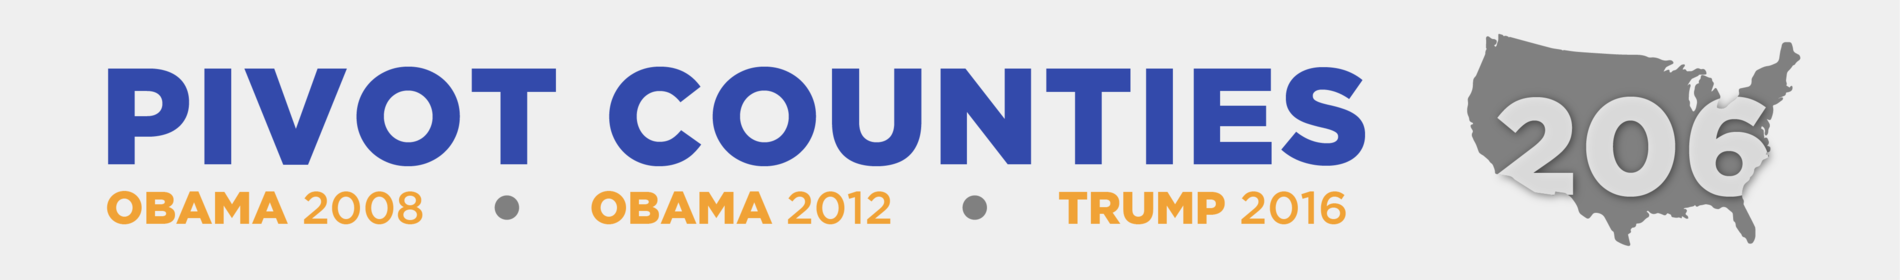
Pivot Counties are the 206 counties nationwide Ballotpedia identified as having voted for Barack Obama (D) in the 2008 and 2012 presidential elections and Donald Trump (R) in 2016. Media and political observers sometimes refer to these counties as swing counties.
Following the 2016 presidential election, Michigan had 12 Pivot Counties.
Ballotpedia defines Pivot Counties Trump won in 2020 as Retained Pivot Counties and those Joe Biden (D) won as Boomerang Pivot Counties.
After the 2020 presidential election, the state had 11 Retained Pivot Counties and one Boomerang Pivot County.
List of Pivot Counties
The table below lists the Pivot Counties in Michigan. These counties accounted for 14.46 percent of the total counties in Michigan, and 18.36 percent of the state population.
| Analysis of Michigan counties won by Trump in 2016 and Obama in 2012 and 2008 following the 2020 presidential election[1] | |||||||
|---|---|---|---|---|---|---|---|
| County | State | Winner, 2020 | Margin of Victory, 2020 | Trump Margin of Victory, 2016 | Obama Margin of Victory, 2012 | Obama Margin of Victory, 2008 | |
| Bay County | Michigan | Retained | +11.57 | +12.55 | +5.56 | +15.31 | |
| Calhoun County | Michigan | Retained | +11.08 | +12.46 | +1.6 | +9.36 | |
| Eaton County | Michigan | Retained | +0.78 | +4.72 | +3.13 | +8.4 | |
| Gogebic County | Michigan | Retained | +12.45 | +14.8 | +8.1 | +17.27 | |
| Isabella County | Michigan | Retained | +2.52 | +3.66 | +9.28 | +19.26 | |
| Lake County | Michigan | Retained | +26.18 | +22.77 | +5.01 | +12.28 | |
| Macomb County | Michigan | Retained | +8.07 | +11.53 | +3.99 | +8.62 | |
| Manistee County | Michigan | Retained | +15.11 | +15.29 | +5.93 | +13.26 | |
| Monroe County | Michigan | Retained | +22.61 | +21.97 | +0.98 | +4.35 | |
| Saginaw County | Michigan | Boomerang | +0.29 | +1.13 | +11.89 | +17.34 | |
| Shiawassee County | Michigan | Retained | +19.85 | +19.59 | +3.67 | +8.59 | |
| Van Buren County | Michigan | Retained | +12.23 | +13.92 | +0.45 | +8.78 | |
The map below shows Retained and Boomerang Pivot Counties in Michigan shaded bright red and blue, respectively.
2020 analysis
Voter turnout
Michigan has 12 Pivot Counties, 14.5% of the state's 83 total counties. Of those 12 Pivot Counties, the state has 11 Retained Pivot Counties and one Boomerang Pivot County, responsible for 16.40% and 1.87% of the statewide turnout, respectively.
| Voter turnout in Michigan and its Pivot Counties | ||||||
|---|---|---|---|---|---|---|
| Votes cast | Voting age population | Turnout | Contribution to statewide turnout | |||
| Overview | ||||||
| Michigan | 5,547,053 | 7,472,660 | 74.23% | - | ||
| Retained Pivot Counties | 909,587 | 1,242,950 | 73.18% | 16.40% | ||
| Boomerang Pivot County | 103,483 | 148,825 | 69.53% | 1.87% | ||
| County-specific | ||||||
|---|---|---|---|---|---|---|
| Votes cast | Voting age population | Turnout | Contribution to statewide turnout | |||
| Bay | 60,255 | 82,555 | 72.99% | 1.09% | ||
| Calhoun | 66,281 | 100,650 | 65.85% | 1.19% | ||
| Eaton | 64,327 | 84,010 | 76.57% | 1.16% | ||
| Gogebic | 8,276 | 12,945 | 63.93% | 0.15% | ||
| Isabella | 29,476 | 57,030 | 51.69% | 0.53% | ||
| Lake | 6,332 | 9,735 | 65.04% | 0.11% | ||
| Macomb | 494,256 | 651,790 | 75.83% | 8.91% | ||
| Manistee | 14,655 | 19,955 | 73.44% | 0.26% | ||
| Monroe | 87,282 | 115,675 | 75.45% | 1.57% | ||
| Saginaw | 103,483 | 148,825 | 69.53% | 1.87% | ||
| Shiawassee | 39,301 | 53,385 | 73.62% | 0.71% | ||
| Van Buren | 39,146 | 55,220 | 70.89% | 0.71% | ||
Demographics
This table displays demographic data, on average, by county compared to nationwide and statewide averages with a focus on Pivot Counties. Use the arrows at the top of the table to view 2016 data and changes from 2016 to 2020. Full demographic data can be found here.
2016 analysis
Voting trends
The table below details the voting trends of the Pivot Counties in Michigan since 1960.
| Presidential Elections in Michigan Pivot Counties since 1960 | ||||||
|---|---|---|---|---|---|---|
| County | Elections won by Republican Presidential candidate | Elections won by Democratic Presidential candidate | Elections matching national result | |||
| Elections | Percentage of elections | Elections | Percentage of elections | Elections | Percentage of elections | |
| Bay County, Michigan | 4 | 26.67% | 11 | 73.33% | 11 | 73.33% |
| Calhoun County, Michigan | 9 | 60.00% | 6 | 40.00% | 12 | 80.00% |
| Eaton County, Michigan | 12 | 80.00% | 3 | 20.00% | 11 | 73.33% |
| Gogebic County, Michigan | 2 | 13.33% | 13 | 86.67% | 9 | 60.00% |
| Isabella County, Michigan | 8 | 53.33% | 7 | 46.67% | 11 | 73.33% |
| Lake County, Michigan | 3 | 20.00% | 12 | 80.00% | 8 | 53.33% |
| Macomb County, Michigan | 8 | 53.33% | 7 | 46.67% | 11 | 73.33% |
| Manistee County, Michigan | 9 | 60.00% | 6 | 40.00% | 12 | 80.00% |
| Monroe County, Michigan | 6 | 40.00% | 9 | 60.00% | 13 | 86.67% |
| Saginaw County, Michigan | 7 | 46.67% | 8 | 53.33% | 10 | 66.67% |
| Shiawassee County, Michigan | 10 | 66.67% | 5 | 33.33% | 13 | 86.67% |
| Van Buren County, Michigan | 10 | 66.67% | 5 | 33.33% | 13 | 86.67% |
| Average | 7 | 48.89% | 8 | 51.11% | 11 | 74.44% |
| Median | 8 | 53.33% | 7 | 46.67% | 11 | 73.33% |
2016 election results
- See also: Presidential election in Michigan, 2016
In 2016, Michigan had 16 electoral votes, which was 3 percent of the 538 electoral votes up for grabs and 6 percent of the 270 electoral votes needed to win the general election. Presidential primary elections in Michigan took place on March 8, 2016. Bernie Sanders won the Democratic primary with 49.7 percent of the vote. Donald Trump won the Republican primary with 36.5 percent.
General election
| U.S. presidential election, Michigan, 2016 | |||||
|---|---|---|---|---|---|
| Party | Candidate | Vote % | Votes | Electoral votes | |
| Democratic | Hillary Clinton/Tim Kaine | 47.3% | 2,268,839 | 0 | |
| Republican | 47.5% | 2,279,543 | 16 | ||
| Libertarian | Gary Johnson/Bill Weld | 3.6% | 172,136 | 0 | |
| Green | Jill Stein/Ajamu Baraka | 1.1% | 51,463 | 0 | |
| U.S. Taxpayers | Darrell Lane Castle/Scott Bradley | 0.3% | 16,139 | 0 | |
| Natural Law | Emidio Soltysik/Angela Nicole Walker | 0% | 2,209 | 0 | |
| Other | Write-in votes | 0.2% | 8,955 | 0 | |
| Total Votes | 4,799,284 | 16 | |||
| Election results via: Michigan Department of State | |||||
Primaries
| Michigan Democratic Primary, 2016 | ||||
|---|---|---|---|---|
| Candidate | Vote % | Votes | Delegates | |
|
|
49.7% | 598,943 | 67 | |
| Hillary Clinton | 48.3% | 581,775 | 63 | |
| Martin O'Malley | 0.2% | 2,363 | 0 | |
| Roque De La Fuente | 0.1% | 870 | 0 | |
| Other | 1.8% | 21,601 | 0 | |
| Totals | 1,205,552 | 130 | ||
| Source: Michigan Secretary of State and The New York Times | ||||
| Michigan Republican Primary, 2016 | ||||
|---|---|---|---|---|
| Candidate | Vote % | Votes | Delegates | |
| Jeb Bush | 0.8% | 10,685 | 0 | |
| Ben Carson | 1.6% | 21,349 | 0 | |
| Chris Christie | 0.2% | 3,116 | 0 | |
| Ted Cruz | 24.7% | 326,617 | 17 | |
| Carly Fiorina | 0.1% | 1,415 | 0 | |
| Lindsey Graham | 0% | 438 | 0 | |
| Mike Huckabee | 0.2% | 2,603 | 0 | |
| John Kasich | 24.3% | 321,115 | 17 | |
| George Pataki | 0% | 591 | 0 | |
| Rand Paul | 0.3% | 3,774 | 0 | |
| Marco Rubio | 9.3% | 123,587 | 0 | |
| Rick Santorum | 0.1% | 1,722 | 0 | |
| 36.5% | 483,753 | 25 | ||
| Other | 1.7% | 22,824 | 0 | |
| Totals | 1,323,589 | 59 | ||
| Source: CNN and Michigan Secretary of State | ||||
See also
- List of Pivot Counties - the 206 counties that voted Obama-Obama-Trump
- Pivot Counties by state
- Presidential election, 2016
Footnotes
- ↑ This analysis does not include counties in Alaska and certain independent cities due to variations in vote total reporting.
| ||||||||||||||||||||||