Pivot Counties in North Carolina
| 2020 Election Analysis: Pivot Counties |
|---|
Retained • Boomerang Margins of victory Voter turnout Demographics |
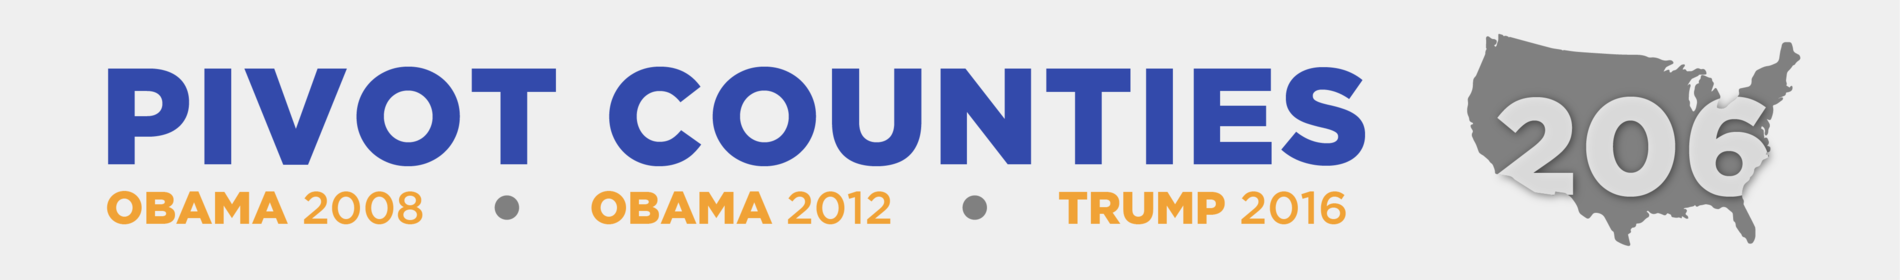
Pivot Counties are the 206 counties nationwide Ballotpedia identified as having voted for Barack Obama (D) in the 2008 and 2012 presidential elections and Donald Trump (R) in 2016. Media and political observers sometimes refer to these counties as swing counties.
Following the 2016 presidential election, North Carolina had six Pivot Counties.
Ballotpedia defines Pivot Counties Trump won in 2020 as Retained Pivot Counties and those Joe Biden (D) won as Boomerang Pivot Counties.
After the 2020 presidential election, all six were Retained Pivot Counties.
List of Pivot Counties
The table below lists the Pivot Counties in North Carolina. These counties accounted for 6 percent of the total counties in North Carolina, and 3.18 percent of the state population.
| Analysis of North Carolina counties won by Trump in 2016 and Obama in 2012 and 2008 following the 2020 presidential election[1] | |||||||
|---|---|---|---|---|---|---|---|
| County | State | Winner, 2020 | Margin of Victory, 2020 | Trump Margin of Victory, 2016 | Obama Margin of Victory, 2012 | Obama Margin of Victory, 2008 | |
| Bladen County | North Carolina | Retained | +13.72 | +9.39 | +1.97 | +2.07 | |
| Gates County | North Carolina | Retained | +13.75 | +9.07 | +4.11 | +5.22 | |
| Granville County | North Carolina | Retained | +6.59 | +2.49 | +4.54 | +6.58 | |
| Martin County | North Carolina | Retained | +4.95 | +0.43 | +4.65 | +4.64 | |
| Richmond County | North Carolina | Retained | +14.81 | +9.74 | +2.95 | +1.5 | |
| Robeson County | North Carolina | Retained | +18.62 | +4.27 | +17.41 | +13.78 | |
The map below shows Retained Pivot Counties in North Carolina shaded bright red.
2020 analysis
Voter turnout
North Carolina has six Retained Pivot Counties, 6.0% of the state's 100 total counties. Turnout in these counties accounted for 2.45% of the statewide total turnout.
| Voter turnout in North Carolina and its Pivot Counties | ||||||
|---|---|---|---|---|---|---|
| Votes cast | Voting age population | Turnout | Contribution to statewide turnout | |||
| Overview | ||||||
| North Carolina | 5,524,802 | 7,413,170 | 74.53% | - | ||
| Retained Pivot Counties | 135,185 | 226,965 | 59.56% | 2.45% | ||
| County-specific | ||||||
|---|---|---|---|---|---|---|
| Votes cast | Voting age population | Turnout | Contribution to statewide turnout | |||
| Bladen | 17,125 | 25,520 | 67.10% | 0.31% | ||
| Gates | 5,971 | 9,140 | 65.33% | 0.11% | ||
| Granville | 31,598 | 45,205 | 69.90% | 0.57% | ||
| Martin | 12,540 | 18,005 | 69.65% | 0.23% | ||
| Richmond | 20,763 | 33,585 | 61.82% | 0.38% | ||
| Robeson | 47,188 | 95,510 | 49.41% | 0.85% | ||
Demographics
This table displays demographic data, on average, by county compared to nationwide and statewide averages with a focus on Pivot Counties. Use the arrows at the top of the table to view 2016 data and changes from 2016 to 2020. Full demographic data can be found here.
2016 analysis
Voting trends
The table below details the voting trends of the Pivot Counties in North Carolina since 1960.
| Presidential Elections in North Carolina Pivot Counties since 1960 | ||||||
|---|---|---|---|---|---|---|
| County | Elections won by Republican Presidential candidate | Elections won by Democratic Presidential candidate | Elections matching national result | |||
| Elections | Percentage of elections | Elections | Percentage of elections | Elections | Percentage of elections | |
| Bladen County, North Carolina | 3 | 20.00% | 11 | 73.33% | 10 | 66.67% |
| Gates County, North Carolina | 2 | 13.33% | 12 | 80.00% | 9 | 60.00% |
| Granville County, North Carolina | 4 | 26.67% | 10 | 66.67% | 11 | 73.33% |
| Martin County, North Carolina | 4 | 26.67% | 10 | 66.67% | 11 | 73.33% |
| Richmond County, North Carolina | 2 | 13.33% | 12 | 80.00% | 9 | 60.00% |
| Robeson County, North Carolina | 2 | 13.33% | 13 | 86.67% | 9 | 60.00% |
| Average | 3 | 18.89% | 11 | 75.56% | 10 | 65.56% |
| Median | 3 | 16.67% | 12 | 76.67% | 10 | 63.33% |
Noteworthy elections
North Carolina's 9th Congressional District elections, 2018 and 2019
North Carolina's 9th Congressional District overlaps with three pivot counties: Bladen, Richmond, and Robeson. Pivot counties are those that Barack Obama (D) won in the 2008 and 2012 presidential elections and Donald Trump (R) won in the 2016 presidential election. The 9th District includes all of Richmond and Robeson counties and part of Bladen County. Compared to the 2018 unofficial results in the 9th District U.S. House election, Bladen and Robeson counties favored the same party in the 2019 House special election while Richmond switched from Democratic to Republican.
In the September 10 special election, Dan Bishop (R) won Bladen and Richmond counties, while Dan McCready (D) won Robeson County. In the 2018 general election for North Carolina's 9th District—the results of which were not certified after allegations of absentee ballot fraud—uncertified results showed McCready leading in Richmond and Robeson and Republican candidate Mark Harris leading in Bladen.
Turnout in the 2019 special election was lower than in the 2018 general election. In 2019, 11,064 fewer votes were tallied for McCready than in 2018. On the Republican side, 6,289 fewer votes were tallied for Bishop than for Harris.
The tables below show the two major-party candidates' percentages of the vote in 2018 and 2019 in the three pivot counties, margins of victory in terms of percentage points, and the total number of votes tallied for the two major-party candidates in 2018 and 2019.
| Percentage of votes: North Carolina's 9th District 2018 and 2019 elections in pivot counties | |||||||
|---|---|---|---|---|---|---|---|
| Percentage of votes | 2018 | Margin of victory | 2019 | Margin of victory | |||
| County | 2018 | 2019 | |||||
| Bladen | 41.0% | 57.6% | R+16.6 | 40.2% | 59.3% | R+19.1 | |
| Richmond | 50.2% | 47.7% | D+2.5 | 47.4% | 52.0% | R+4.6 | |
| Robeson | 56.4% | 41.1% | D+15.3 | 50.5% | 49.1% | D+1.4 | |
Notes: Results of the 2018 election were not certified.
Percentages do not equal 100 because votes for third-party candidates are not featured in the table.
Source: North Carolina State Board of Elections (2018) (2019)
| Number of votes: North Carolina's 9th District 2018 and 2019 elections in pivot counties | |||||||
|---|---|---|---|---|---|---|---|
| Number of votes | Democratic vote | 2018-2019 change | Republican vote | 2018-2019 change | |||
| County | D change | R change | |||||
| Bladen | 3,856 | 2,371 | -1,485 | 5,413 | 3,496 | -1,917 | |
| Richmond | 7,138 | 4,309 | -2,829 | 6,786 | 4,727 | -2,059 | |
| Robeson | 17,419 | 10,669 | -6,750 | 12,691 | 10,378 | -2,313 | |
Note: Results of the 2018 election were not certified.
Source: North Carolina State Board of Elections (2018) (2019)
2016 election results
In 2016, North Carolina had 15 electoral votes, which was 2.7 percent of the 538 electoral votes up for grabs and 5.5 percent of the 270 electoral votes needed to win the general election. Presidential primary elections in North Carolina took place on March 15, 2016. Hillary Clinton won the Democratic primary with 54.5 percent of the vote. Donald Trump won the Republican primary with 40.2 percent.
General election
| U.S. presidential election, North Carolina, 2016 | |||||
|---|---|---|---|---|---|
| Party | Candidate | Vote % | Votes | Electoral votes | |
| Democratic | Hillary Clinton/Tim Kaine | 46.2% | 2,189,316 | 0 | |
| Republican | 49.8% | 2,362,631 | 15 | ||
| Libertarian | Gary Johnson/Bill Weld | 2.7% | 130,126 | 0 | |
| - | Write-in votes | 1.3% | 59,491 | 0 | |
| Total Votes | 4,741,564 | 15 | |||
| Election results via: North Carolina State Board of Elections | |||||
Primaries
| North Carolina Democratic Primary, 2016 | ||||
|---|---|---|---|---|
| Candidate | Vote % | Votes | Delegates | |
|
|
54.5% | 622,915 | 60 | |
| Bernie Sanders | 40.9% | 467,018 | 47 | |
| Martin O'Malley | 1.1% | 12,122 | 0 | |
| Roque De La Fuente | 0.3% | 3,376 | 0 | |
| Other | 3.3% | 37,485 | 0 | |
| Totals | 1,142,916 | 107 | ||
| Source: The New York Times and North Carolina State Board of Elections | ||||
| North Carolina Republican Primary, 2016 | ||||
|---|---|---|---|---|
| Candidate | Vote % | Votes | Delegates | |
|
|
40.2% | 462,413 | 29 | |
| Ted Cruz | 36.8% | 422,621 | 27 | |
| John Kasich | 12.7% | 145,659 | 9 | |
| Marco Rubio | 7.7% | 88,907 | 6 | |
| Ben Carson | 1% | 11,019 | 1 | |
| Jeb Bush | 0.3% | 3,893 | 0 | |
| Mike Huckabee | 0.3% | 3,071 | 0 | |
| Rand Paul | 0.2% | 2,753 | 0 | |
| Chris Christie | 0.1% | 1,256 | 0 | |
| Carly Fiorina | 0.1% | 929 | 0 | |
| Rick Santorum | 0.1% | 663 | 0 | |
| Jim Gilmore | 0% | 265 | 0 | |
| Other | 0.5% | 6,081 | 0 | |
| Totals | 1,149,530 | 72 | ||
| Source: The New York Times and North Carolina Board of Elections | ||||
See also
- List of Pivot Counties - the 206 counties that voted Obama-Obama-Trump
- Pivot Counties by state
- Presidential election, 2016
Footnotes
- ↑ This analysis does not include counties in Alaska and certain independent cities due to variations in vote total reporting.
| ||||||||||||||||||||||