Public education in Maryland
| K-12 education in Maryland | |
 | |
| Education facts | |
| State superintendent: Carey M. Wright | |
| Number of students: 909,003 | |
| Number of teachers: 61,438 | |
| Teacher/pupil ratio: 1:14.7 | |
| Number of school districts: 24 | |
| Number of schools: 1,420 | |
| Graduation rate: 87% | |
| Per-pupil spending: $15,489 | |
| See also | |
| Maryland Department of Education • List of school districts in Maryland • Maryland • School boards portal | |
Public education in the United States Public education in Maryland Glossary of education terms | |
| Note: These statistics are mainly from government sources, including the U.S. Census Bureau and the National Center for Education Statistics. Figures given were the most recent as of October 2022. | |
The Maryland public school system (prekindergarten through grade 12) operates within districts governed by locally elected school boards and superintendents. In 2022, Maryland had 909,003 students enrolled in a total of 1,420 schools in 24 school districts. There were 61,438 teachers in the public schools, or roughly one teacher for every 15 students, compared to the national average of 1:16. In 2020, Maryland spent on average $15,489 per pupil.[1] The state's graduation rate was 87 percent in the 2018-2019 school year.[2]
General information
- See also: General comparison table for education statistics in the 50 states and Education spending per pupil in all 50 states
The following chart shows how Maryland compares to the national level for the most recent years for which data is available.
| Public education in Maryland | |||||||
|---|---|---|---|---|---|---|---|
| State | Schools | Districts | Students | Teachers | Teacher to pupil ratio | Per pupil spending* | |
| Maryland | 1,420 | 24 | 909,003 | 61,438 | 1:14.7 | $15,489 | |
| United States | 90,323 | 13,194 | 47,755,383 | 2,783,705 | 1:16 | $13,494 | |
| *Per pupil spending data reflects information reported for fiscal year 2020. Sources: Education statistics in the United States | |||||||
Academic performance
The sections below do not contain the most recently published data on this subject. If you would like to help our coverage grow, consider donating to Ballotpedia.
| Education terms |
|---|
| For more information on education policy terms, see this article. |
NAEP scores
- See also: NAEP scores by state
The National Center for Education Statistics provides state-by-state data on student achievement levels in mathematics and reading in the National Assessment of Educational Progress (NAEP). The table below presents the percentage of fourth and eighth grade students that scored at or above proficient in reading and math during school year 2012-2013. Compared to three neighboring states (Delaware, New Jersey, and Virginia), Maryland had the highest share of the fourth graders who scored at or above proficient in reading.[3]
| Percent of students scoring at or above proficient, 2012-2013 | ||||
|---|---|---|---|---|
| Math - Grade 4 | Math - Grade 8 | Reading - Grade 4 | Reading - Grade 8 | |
| Maryland | 47% | 37% | 45% | 42% |
| Delaware | 42% | 33% | 38% | 33% |
| New Jersey | 49% | 49% | 42% | 46% |
| Virginia | 47% | 38% | 43% | 36% |
| United States | 41% | 34% | 34% | 34% |
| Source: United States Department of Education, ED Data Express, "State Tables" | ||||
Graduation, ACT and SAT scores
The following table shows the graduation rates and average composite ACT and SAT scores for Maryland and surrounding states during the 2012-2013 school year. All statements made in this section refer to that school year.[3][4][5]
In the United States, public schools reported graduation rates that averaged to about 81.4 percent. About 54 percent of all students in the country took the ACT, while 50 percent reported taking the SAT. The average national composite scores for those tests were 20.9 out of a possible 36 for the ACT, and 1498 out of a possible 2400 for the SAT.[6]
Maryland schools reported a graduation rate of 85 percent during the 2012-2013 school year, second-highest among its neighboring states
In Maryland, more students took the SAT than the ACT in 2013, earning an average SAT score of 1483.
| Comparison table for graduation rates and test scores, 2012-2013 | |||||||
|---|---|---|---|---|---|---|---|
| State | Graduation rate, 2013 | Average ACT composite, 2013 | Average SAT composite, 2013 | ||||
| Percent | Quintile ranking** | Score | Participation rate | Score | Participation rate | ||
| Maryland | 85% | Second | 22.3 | 21% | 1483 | 73% | |
| Delaware | 80.4% | Fourth | 22.9 | 15% | 1351 | 100% | |
| New Jersey | 87.5% | First | 23 | 23% | 1521 | 78% | |
| Virginia | 84.5% | Third | 22.6 | 26% | 1528 | 71% | |
| United States | 81.4% | 20.9 | 54% | 1498 | 50% | ||
| **Graduation rates for states in the first quintile ranked in the top 20 percent nationally. Similarly, graduation rates for states in the fifth quintile ranked in the bottom 20 percent nationally. Sources: United States Department of Education, "ED Data Express," accessed May 28, 2015 ACT.org, "2013 ACT National and State Scores," accessed May 28, 2015 The Commonwealth Foundation, "SAT scores by state, 2013," accessed May 28, 2015 | |||||||
Dropout rate
- See also: Public high school dropout rates by state for a full comparison of dropout rates by group in all states
The high school event dropout rate indicates the proportion of students who were enrolled at some time during the school year and were expected to be enrolled in grades nine through 12 in the following school year but were not enrolled by October 1 of the following school year. Students who have graduated, transferred to another school, died, moved to another country, or who are out of school due to illness are not considered dropouts. The average public high school event dropout rate for the United States remained constant at 3.3 percent for both school year 2010–2011 and school year 2011–2012. The event dropout rate for Maryland was on par with the national average at 3.3 percent in the 2010-2011 school year. The dropout rate was higher than the national average at 3.8 percent in the 2011-2012 school year.[7]
Educational choice options
- See also: School choice in Maryland
School choice options in Maryland included charter schools and supplemental online learning programs as of June 2015. In addition, about 14.17 percent of school-age children in the state attended private schools in the 2011-2012 academic year, and an estimated 2.67 percent were homeschooled in 2012-2013.
Developments
Espinoza v. Montana Department of Revenue (2020)
On June 30, 2020, the U.S. Supreme Court decided Espinoza v. Montana Department of Revenue, which concerned whether the government can exclude religious institutions from student-aid programs. The case related to Article X, Section 6 of the Montana Constitution, also known as Montana’s Blaine Amendment.[8]
In its 5-4 opinion, the court held that the application of Article X, Section 6 violated the free exercise clause of the U.S. Constitution. The majority held Article X, Section 6 barred religious schools and parents who wished to send their children to those schools from receiving public benefits because of the religious character of the school.[9]
The case addressed the tension between the free exercise and Establishment clauses of the U.S. Constitution—where one guarantees the right of individuals' free exercise of religion and the other guarantees that the state won't establish a religion—and the intersections of state constitutions with state law and with the U.S. Constitution.
Maryland is not one of the states with a Blaine Amendment.
Education funding and expenditures
- See also: Maryland state budget and finances
Source: National Association of State Budget Officers
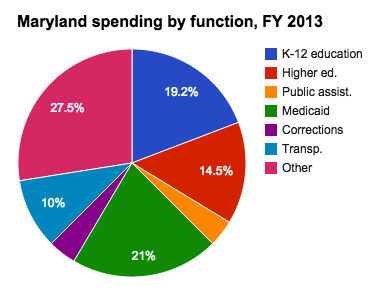
According to the National Association of State Budget Officers (NASBO), states spent an average of 19.8 percent of their total budgets on elementary and secondary education during fiscal year 2013. In addition, the United States Census Bureau found that approximately 45.6 percent of the country's school system revenue came from state sources, while about 45.3 percent came from local sources. The remaining portion of school system revenue came from federal sources.[10][11]
Maryland spent approximately 19.2 percent of its budget on elementary and secondary education during fiscal year 2013. The state school systems' revenue came primarily from local funds. Maryland spent the second lowest percentage of its total budget on public education when compared to its neighboring states.
| Comparison of financial figures for school systems, fiscal year 2013 | |||||||
|---|---|---|---|---|---|---|---|
| State | Percentage of budget | Per pupil spending | Revenue sources | ||||
| Percent federal funds | Percent state funds | Percent local funds | |||||
| Maryland | 19.2% | $13,829 | 6% | 44.1% | 49.9% | ||
| Delaware | 24.3% | $13,833 | 8% | 59.8% | 32.2% | ||
| New Jersey | 24.9% | $17,572 | 4.1% | 38.7% | 57.2% | ||
| Virginia | 15.1% | $10,960 | 7.4% | 39.2% | 53.4% | ||
| United States | 19.8% | $10,700 | 9.1% | 45.6% | 45.3% | ||
| Sources: NASBO, "State Expenditure Report" (Table 8). U.S. Census Bureau, "Public Education Finances: 2013, Economic Reimbursable Surveys Division Reports" (Table 5 and Table 8). | |||||||
Revenue breakdowns
- See also: Public school system revenues in the U.S. to compare all states.
According to the United States Census Bureau, public school system revenues totaled approximately $598 billion in fiscal year 2013.[11]
In Maryland, the primary source of school system revenue was local funding, at $6.9 billion. Maryland reported the second lowest total public education revenue when compared to its neighboring states.
| Revenues by source, fiscal year 2013 (amounts in thousands) | ||||
|---|---|---|---|---|
| State | Federal revenue | State revenue | Local revenue | Total revenue |
| Maryland | $828,432 | $6,093,652 | $6,888,206 | $13,810,290 |
| Delaware | $151,096 | $1,124,112 | $604,386 | $1,879,594 |
| New Jersey | $1,120,771 | $10,458,175 | $15,449,220 | $27,028,166 |
| Virginia | $1,108,879 | $5,874,323 | $8,000,628 | $14,983,830 |
| United States | $54,367,305 | $272,916,892 | $270,645,402 | $597,929,599 |
| Source: U.S. Census Bureau, "Public Education Finances: 2013, Economic Reimbursable Surveys Division Reports" (Table 1) | ||||
Expenditure breakdowns
According to the National Center for Education Statistics, public school system expenditures totaled approximately $602 billion in fiscal year 2012.[12]
Public education expenditures in Maryland totaled approximately $13.2 billion in fiscal year 2012. This was the second lowest total public education expenditures when compared to its neighboring states.
| Expenditures by type, fiscal year 2012 (amounts in thousands) | ||||
|---|---|---|---|---|
| State | General expenditures | Capital outlay | Other | Total expenditures |
| Maryland | $11,846,681 | $1,166,855 | $191,240 | $13,204,777 |
| Delaware | $1,751,143 | $160,863 | $66,556 | $1,978,562 |
| New Jersey | $24,391,278 | $912,022 | $828,162 | $26,131,462 |
| Virginia | $13,403,576 | $1,078,786 | $248,334 | $14,730,695 |
| United States | $527,096,473 | $48,773,386 | $25,897,123 | $601,766,981 |
| Source: National Center for Education Statistics, "Revenues and Expenditures for Public Elementary and Secondary Education: School Year 2011–12 (Fiscal Year 2012)" (Table 5) | ||||
Personnel salaries
According to the National Center for Education Statistics, the average national salary for classroom teachers in public elementary and secondary schools declined by 1.3 percent from the 1999-2000 school year to the 2012-2013 school year. During the same period in Maryland, the average salary increased by 8.4 percent.[14]
| Estimated average salaries for teachers (in constant dollars**) | |||||
|---|---|---|---|---|---|
| 1999-2000 | 2009-2010 | 2011-2012 | 2012-2013 | Percent difference | |
| Maryland | $60,196 | $68,285 | $64,693 | $65,265 | 8.4% |
| Delaware | $60,724 | $60,930 | $59,779 | $59,679 | -1.7% |
| New Jersey | $71,083 | $69,523 | $68,194 | $68,797 | -3.2% |
| Virginia | $52,947 | $53,388 | $49,514 | $49,869 | -5.8% |
| United States | $57,133 | $58,925 | $56,340 | $56,383 | -1.3% |
| **"Constant dollars based on the Consumer Price Index (CPI), prepared by the Bureau of Labor Statistics, U.S. Department of Labor, adjusted to a school-year basis. The CPI does not account for differences in inflation rates from state to state." | |||||
Organizations
State agencies
- See also: Maryland State Department of Education
The Maryland State Department of Education is helmed by the Superintendent of Schools, who is appointed by the Maryland State Board of Education to four-year, renewable terms. Lillian Lowery was appointed to the position in 2012.[15][16]
The State Board of Education is composed of 12 members appointed by the Governor. With the exception of the student member (who serves for one year), all members serve four-year terms. Board members may serve two full terms.[16]
Unions
In 2012 the Fordham Institute and Education Reform Now assessed the power and influence of state teacher unions in all 50 states and the District of Columbia. Their rankings were based on 37 different variables in five broad areas: resources and membership, involvement in politics, scope of bargaining, state policies and perceived influence. Maryland ranked 23rd overall for union power and influence, or "average," which was in the third of five tiers.[17]
The main unions related to the Maryland school system are the Maryland State Education Association (MSEA), an affiliate of the National Education Association (NEA) and AFT Maryland. For the 2003 tax period MSEA had: $13.9 million in total revenue, $13.7 million in total expenses and $11.5 million in total assets.[18] For the same period, AFT Maryland had: $1.1 million in total revenue, $1.1 million in total expenses and $337,687 in total assets.[19]
List of local Maryland school unions:[20]
- Maryland State Education Association
- AFT Maryland
- Baltimore Teachers Union
- Montgomery County Education Association, Maryland
- Teachers Association of Baltimore County
- Frederick County Teachers Association Of Maryland
- Teachers Association of Anne Arundel County
- Washington County Teachers Association
- Cecil County Classroom Teachers Association
Government sector lobbying
- See also: Maryland government sector lobbying
The main education government sector lobbying organization is the Maryland Association of Boards of Education.
Studies and reports
Quality Counts 2014
- See also: Education Week survey
Education Week, a publication that reports on many education issues throughout the country, began using an evaluation system in 1997 to grade each state on various elements of education performance. This system, called Quality Counts, uses official data on performance from each state to generate report cards for all 50 states and the District of Columbia. The report card in 2014 uses six different categories:
- Chance for success
- K-12 achievement
- Standards, assessments and accountability
- The teaching profession
- School finance
- Transitions and alignment
Each of these six categories had a number of other elements that received individual scores. Those scores were then averaged and used to determine the final score in each category. Every state received two types of scores for each of the six major categories: A numerical score out of 100 and a letter grade based on that score. Education Week used the score for the first category, "chance for success," as the value for ranking each state and the District of Columbia. The average grade received in the entire country was 77.3, or a C+ average. The country's highest average score was in the category of "standards, assessments and accountability" at 85.3, or a B average. The lowest average score was in "K-12 achievement", at 70.2, or a C- average.
Maryland received a score of 85.9, or a B average in the "chance for success" category. This was above the national average. The state's highest score was in "transitions and alignment" at 96.4, or an A average. The lowest score was in "K-12 achievement" at 83.1, or a B average. Maryland had the eighth highest score for "chance for success" in the country. The chart below displays the scores of Maryland and its surrounding states.[21]
Note: Click on a column heading to sort the data.
| Public education report cards, 2014 | ||||||
|---|---|---|---|---|---|---|
| State | Chance for success | K-12 achievement | Standards, assessments and accountability | The teaching profession | School finance | Transitions and alignment |
| Maryland | 85.9 (B) | 83.1 (B) | 88.3 (B+) | 83.7 (B) | 85.2 (B) | 96.4 (A) |
| Delaware | 79.8 (B-) | 68.5 (D+) | 87.5 (B+) | 74.4 (C) | 80.0 (B-) | 78.6 (C+) |
| New Jersey | 88.2 (B+) | 82.1 (B-) | 75.5 (C) | 67.2 (D+) | 84.5 (B) | 82.1 (B-) |
| Virginia | 84.8 (B) | 74.2 (C) | 93.3 (A) | 81.9 (B-) | 76.1 (C) | 85.7 (B) |
| United States average | 77.3 (C+) | 70.2 (C-) | 85.3 (B) | 72.5 (C) | 75.5 (C) | 81.1 (B-) |
| Source: Education Week, "Quality Counts 2014" A full discussion of how these numbers were generated can be found here. | ||||||
State Budget Solutions education study
State Budget Solutions examined national trends in education from 2009 to 2011, including state-by-state analysis of education spending, graduation rates and average ACT scores. The study showed that the states that spent the most did not have the highest average ACT test scores, nor did they have the highest average graduation rates. A summary of the study is available here. The full report can be accessed here.
School districts
- See also: School board elections portal
District types
Maryland is generally made up of county school districts, which are administered by a county board of education; they are either appointed by the governor or elected. Baltimore City Public School System is considered a system that is dependent upon the municipal government. It is governed by a board of commissioners jointly appointed by the governor and the mayor. Fiscal requirements are provided by the city of Baltimore. The Baltimore City School System is not counted as a separate government, rather it is classified as a dependent agency of Baltimore.[22]
School board composition
The composition of school boards in Maryland varies widely; they can be made up of anywhere from five to eleven members and either be appointed or elected. While there is no statewide standard, the board must adhere to the Maryland Public Ethics Law.[23]
Term limits
Members of appointed school boards may serve two terms, however elected school boards in Maryland are not subject to term limits.[24]
Elections
- See also: Maryland school board elections, 2025
No Maryland school districts within Ballotpedia's coverage scope are holding school board elections in 2025.
Our coverage scope for local elections continues to grow, and you can use Ballotpedia's sample ballot tool to see what school board elections we are covering in your area.
Path to the ballot
The qualifications for school board candidates in Maryland depend on the county. Persons wishing to file should contact their county office.[25]
Recent legislation
The following is a list of recent education bills that have been introduced in or passed by the Maryland state legislature. To learn more about each of these bills, click the bill title. This information is provided by BillTrack50 and LegiScan.
- Note: Due to the nature of the sorting process used to generate this list, some results may not be relevant to the topic. If no bills are displayed below, no legislation pertaining to this topic has been introduced in the legislature recently.
Education ballot measures
- See also: Education on the ballot and List of Maryland ballot measures
Ballotpedia has tracked the following statewide ballot measures relating to education.
- Maryland In-State Tuition Referendum, Question 4 (2012)
- Maryland Question 18, State Voucher Program Referendum (1972)
- Maryland Question 14, State Funding for Nonpublic School Equipment, Materials, and Transportation Referendum (1974)
- Maryland Question 1, Gambling Revenue Dedicated to Education Lockbox Amendment (2018)
In the news
The link below is to the most recent stories in a Google news search for the terms Maryland education policy. These results are automatically generated from Google. Ballotpedia does not curate or endorse these articles.
See also
- Historical public education information in Maryland
- Maryland state budget and finances
- Maryland Department of Education
- List of school districts in Maryland
- School choice in Maryland
- Charter schools in Maryland
- Maryland
- Education Policy in the U.S.
External links
- Maryland State Department of Education (MSDOE)
- Maryland State Superintendent of Schools
- Maryland State Board of Education
- Maryland Schools and Districts (MSDOE)
- Maryland Charter Schools (MSDOE)
- Accountability and Assessment (MSDOE)
- Maryland Education Report Card
- Association of Independent Maryland Schools
- Maryland Virtual High School
Footnotes
- ↑ United States Census Bureau, "U.S. School System Current Spending Per Pupil by Region: Fiscal Year 2020," May 18, 2022
- ↑ National Center for Education Statistics, "Fast Facts: High school graduation rates," accessed September 28, 2022
- ↑ 3.0 3.1 United States Department of Education, ED Data Express, "State Tables," accessed May 13, 2014
- ↑ ACT, "2012 ACT National and State Scores," accessed May 13, 2014
- ↑ Commonwealth Foundation, "SAT Scores by State 2013," October 10, 2013
- ↑ StudyPoints, "What's a good SAT score or ACT score?" accessed June 7, 2015
- ↑ United States Department of Education, National Center for Education Statistics, "Common Core of Data (CCD), State Dropout and Graduation Rate Data File, School Year 2010-11, Provision Version 1a and School Year 2011-12, Preliminary Version 1a," accessed May 13, 2014
- ↑ Supreme Court of the United States, Espinoza v. Montana Department of Revenue: "Petition for a writ of certiorari," accessed July 3, 2019
- ↑ Supreme Court of the United States, Espinoza v. Montana Department of Revenue, decided June 30, 2020
- ↑ NASBO, "State Expenditure Report," accessed July 2, 2015
- ↑ 11.0 11.1 U.S. Census Bureau, "Public Education Finances: 2013, Economic Reimbursable Surveys Division Reports," accessed July 2, 2015
- ↑ National Center for Education Statistics, "Revenues and Expenditures for Public Elementary and Secondary Education: School Year 2011–12 (Fiscal Year 2012)," accessed July 2, 2015
- ↑ Maciver Institute, "REPORT: How much are teachers really paid?" accessed October 29, 2014
- ↑ United States Department of Education, National Center for Education Statistics, "Table 211.60. Estimated average annual salary of teachers in public elementary and secondary schools, by state: Selected years, 1969-70 through 2012-13," accessed May 13, 2014
- ↑ Maryland State Department of Education, "Superintendent's Biography," accessed May 20, 2014
- ↑ 16.0 16.1 Maryland State Department of Education, "Maryland State Board of Education," accessed May 20, 2014
- ↑ Thomas E Fordham Institute, " How Strong Are U.S. Teacher Unions? A State-By-State Comparison," October 29, 2012
- ↑ Center for Union Facts, "Maryland State Education Association," accessed September 22, 2009
- ↑ Center for Union Facts, "AFT Maryland," accessed September 22, 2009
- ↑ Center for Union Facts, "State of Maryland," accessed September 22, 2009 (dead link)
- ↑ Education Week "Quality Counts 2014," accessed February 19, 2015
- ↑ United States Census Bureau, "Maryland," accessed July 11, 2014
- ↑ Maryland State, "Public Ethics Law," October 1, 2013
- ↑ Electronic School, "Survey of the State School Boards Associations on Term Limits for Local Board Members," accessed July 9, 2014
- ↑ Maryland State Board of Elections, "Qualifications for Filing Candidacy," accessed July 14, 2014