New York state executive official elections, 2014
2015 →
← 2013
|
| 2014 State Executive Official Elections |
| Alabama • Alaska • Arizona • Arkansas • California • Colorado • Connecticut • Delaware • Florida • Georgia • Hawaii • Idaho • Illinois • Indiana • Iowa • Kansas • Louisiana • Maine • Maryland • Massachusetts • Michigan • Minnesota • Missouri • Montana • Nebraska • Nevada • New Hampshire • New Mexico • New York • North Dakota • Ohio • Oklahoma • Oregon • Pennsylvania • Rhode Island • South Carolina • South Dakota • Tennessee • Texas • Utah • Vermont • Wisconsin • Wyoming |
| Partisan breakdown Candidates by office Voter turnout Key deadlines State executive organization Ballotpedia reports Recent news See also |
| News • Calendar |
Four state executive positions were up for election in 2014 in the state of New York. The general election took place on November 4, 2014.
In addition to candidate lists and election results, this page includes information about important dates, how the state's executive branch is organized, as well as links to articles about recent news in races across the state.
A primary election is an election in which registered voters select a candidate that they believe should be a political party's candidate for elected office to run in the general election. They are also used to choose convention delegates and party leaders. Primaries are state-level and local-level elections that take place prior to a general election. New York utilizes a closed primary process, in which the selection of a party's candidates in an election is limited to registered party members.[1][2]
For information about which offices are nominated via primary election, see this article.
The following offices were elected in 2014 in New York:
Partisan breakdown
Heading into the November 4 election, the Democratic Party held all four executive seats in New York.
| New York State Executives -- Partisan Breakdown | |||
|---|---|---|---|
| Party | As of November 4, 2014 | After the 2014 Election | |
| Democratic Party | 4 | 4 | |
| Republican Party | 0 | 0 | |
| Total | 4 | 4 | |
Candidates by office
| Office | Incumbent | Assumed Office | Incumbent running? | General Election Candidates | 2015 Winner | Partisan Switch? |
| Governor | Andrew Cuomo  |
2011 | Yes |
|
No | |
| Lieutenant Governor | Robert Duffy  |
2011 | No[3] |
|
No | |
| Attorney General | Eric Schneiderman  |
2011 | Yes | No | ||
| Comptroller | Thomas DiNapoli  |
2007 | Yes |
|
No |
Primary results
Governor
Democratic primary
| Governor of New York, Democratic Primary, 2014 | ||||
|---|---|---|---|---|
| Candidate | Vote % | Votes | ||
| 62.9% | 361,380 | |||
| Zephyr Teachout | 33.5% | 192,210 | ||
| Randy Credico | 3.6% | 20,760 | ||
| Total Votes | 574,350 | |||
| Election results via New York State Board of Elections. | ||||
Republican primary
Rob Astorino did not face opposition for the Republican nomination.
Lieutenant Governor
Democratic primary
| Lieutenant Governor of New York, Democratic Primary, 2014 | ||||
|---|---|---|---|---|
| Candidate | Vote % | Votes | ||
| 60.2% | 329,089 | |||
| Tim Wu | 39.8% | 217,614 | ||
| Total Votes | 546,703 | |||
| Election results via New York State Board of Elections. | ||||
Republican primary
Chris Moss did not face opposition for the Republican nomination.
Attorney General
There was no primary in the attorney general race, as Eric Schneiderman and John Cahill won the Democratic and Republican nominations without opposition.
Comptroller
There was no primary in the comptroller race, as Thomas DiNapoli and Bob Antonacci won the Democratic and Republican nominations without opposition.
General election results
The general election took place on November 4, 2014.
Governor and Lieutenant Governor
| Governor and Lieutenant Governor of New York, 2014 | ||||
|---|---|---|---|---|
| Party | Candidate | Vote % | Votes | |
| Democratic | 54.3% | 2,069,480 | ||
| Republican | Rob Astorino/Chris Moss | 40.3% | 1,536,879 | |
| Green | Howie Hawkins/Brian Jones | 4.8% | 184,419 | |
| Libertarian | Michael McDermott/Chris Edes | 0.4% | 16,967 | |
| Sapient | Steven Cohn/Bobby K. Kalotee | 0.1% | 4,963 | |
| Total Votes | 3,812,708 | |||
| Election results via New York State Board of Elections | ||||
Attorney General
| Attorney General of New York, 2014 | ||||
|---|---|---|---|---|
| Party | Candidate | Vote % | Votes | |
| Democratic | 55.7% | 2,069,956 | ||
| Republican | John Cahill | 41.4% | 1,538,990 | |
| Green | Ramon Jimenez | 2.2% | 80,813 | |
| Libertarian | Carl Person | 0.7% | 24,746 | |
| Total Votes | 3,714,505 | |||
| Election results via New York State Board of Elections | ||||
Comptroller
| New York Controller, 2014 | ||||
|---|---|---|---|---|
| Party | Candidate | Vote % | Votes | |
| Democratic | 60.2% | 2,233,057 | ||
| Republican | Bob Antonacci | 36.5% | 1,354,643 | |
| Green | Theresa Portelli | 2.6% | 97,906 | |
| Libertarian | John Clifton | 0.7% | 26,583 | |
| Total Votes | 3,712,189 | |||
| Election results via New York State Board of Elections | ||||
Voter turnout
Political scientist Michael McDonald's United States Elections Project studied voter turnout in the 2014 election by looking at the percentage of eligible voters who headed to the polls. McDonald used voting-eligible population (VEP), or the number of eligible voters independent of their current registration status, to calculate turnout rates in each state on November 4. He also incorporated ballots cast for the highest office in each state into his calculation. He estimated that 81,687,059 ballots were cast in the 50 states plus the District of Columbia, representing 35.9 percent of the VEP.[4] By comparison, 61.6 percent of VEP voted in the 2008 presidential election and 58.2 percent of VEP voted in the 2012 presidential election.[5]
Quick facts
- According to PBS Newshour, voter turnout in the 2014 midterms was the lowest since the 1942 midterms, which took place during the nation's involvement in World War II.[6]
- Forty-three states and the District of Columbia failed to surpass 50 percent turnout in McDonald's analysis.
- The three states with the lowest turnout according to McDonald's analysis were Texas (28.3 percent), Tennessee (28.6 percent), and Indiana (28.8 percent).
- Maine (58.5 percent), Wisconsin (56.5 percent), and Colorado (54.5 percent) were the three states with the highest turnout.
- There were only 12 states that increased voter turnout in 2014 compared to the 2010 midterm elections.[7]
| Voter turnout rates, 2014 | |||||
|---|---|---|---|---|---|
| State | Total votes counted | % voter eligible population | Top statewide office up for election | Size of lead (Raw votes) | Size of lead (%) |
| Alabama | 1,191,274 | 33.2 | Governor | 320,319 | 27.2 |
| Alaska | 285,431 | 54.4 | Governor | 4,004 | 1.6 |
| Arizona | 1,537,671 | 34.1 | Governor | 143,951 | 12.5 |
| Arkansas | 852,642 | 40.1 | Governor | 118,664 | 14.0 |
| California | 7,513,972 | 30.8 | Governor | 1,065,748 | 17.8 |
| Colorado | 2,080,071 | 54.5 | Governor | 50,395 | 2.4 |
| Connecticut | 1,096,509 | 42.5 | Governor | 26,603 | 2.5 |
| Delaware | 234,038 | 34.4 | Attorney General | 31,155 | 13.6 |
| District of Columbia | 177,176 | 35.8 | Mayor | 27,934 | 19.0 |
| Florida | 6,026,802 | 43.3 | Governor | 66,127 | 1.1 |
| Georgia | 2,596,947 | 38.5 | Governor | 202,685 | 8.0 |
| Hawaii | 369,554 | 36.5 | Governor | 45,323 | 12.4 |
| Idaho | 445,307 | 39.6 | Governor | 65,852 | 14.9 |
| Illinois | 3,680,417 | 40.9 | Governor | 171,900 | 4.9 |
| Indiana | 1,387,622 | 28.8 | Secretary of State | 234,978 | 17.8 |
| Iowa | 1,142,284 | 50.2 | Governor | 245,548 | 21.8 |
| Kansas | 887,023 | 43.4 | Governor | 33,052 | 3.9 |
| Kentucky | 1,435,868 | 44.0 | U.S. Senate | 222,096 | 15.5 |
| Louisiana | 1,472,039 | 43.8 | U.S. Senate | 16,401 | 1.1 |
| Maine | 616,996 | 58.5 | Governor | 29,820 | 4.9 |
| Maryland | 1,733,177 | 41.5 | Governor | 88,648 | 6.1 |
| Massachusetts | 2,186,789 | 44.6 | Governor | 40,361 | 1.9 |
| Michigan | 3,188,956 | 43.2 | Governor | 129,547 | 4.3 |
| Minnesota | 1,992,613 | 50.5 | Governor | 109,776 | 5.6 |
| Mississippi | 631,858 | 28.9 | U.S. Senate | 141,234 | 33.0 |
| Missouri | 1,426,303 | 31.8 | Auditor | 684,074 | 53.6 |
| Montana | 373,831 | 47.3 | U.S. Senate | 65,262 | 17.9 |
| Nebraska | 552,115 | 41.5 | Governor | 97,678 | 18.7 |
| Nevada | 547,349 | 29.0 | Governor | 255,793 | 46.7 |
| New Hampshire | 495,565 | 48.4 | Governor | 24,924 | 5.2 |
| New Jersey | 1,955,042 | 32.5 | N/A | N/A | N/A |
| New Mexico | 512,805 | 35.7 | Governor | 73,868 | 14.6 |
| New York | 3,930,310 | 29.0 | Governor | 476,252 | 13.4 |
| North Carolina | 2,939,767 | 41.2 | U.S. Senate | 48,511 | 1.7 |
| North Dakota | 255,128 | 45.0 | U.S. House At-large seat | 42,214 | 17.1 |
| Ohio | 3,149,876 | 36.2 | Governor | 933,235 | 30.9 |
| Oklahoma | 824,831 | 29.8 | Governor | 122,060 | 14.7 |
| Oregon | 1,541,782 | 53.5 | Governor | 59,029 | 4.5 |
| Pennsylvania | 3,495,866 | 36.0 | Governor | 339,261 | 9.8 |
| Rhode Island | 329,212 | 42.2 | Governor | 14,346 | 4.5 |
| South Carolina | 1,261,611 | 35.2 | Governor | 179,089 | 14.6 |
| South Dakota | 282,291 | 44.9 | Governor | 124,865 | 45.1 |
| Tennessee | 1,374,065 | 28.6 | Governor | 642,214 | 47.5 |
| Texas | 4,727,208 | 28.3 | Governor | 957,973 | 20.4 |
| Utah | 577,973 | 30.2 | Attorney General | 173,819 | 35.2 |
| Vermont | 193,087 | 38.8 | Governor | 2,095 | 1.1 |
| Virginia | 2,194,346 | 36.6 | U.S. Senate | 16,727 | 0.8 |
| Washington | 2,123,901 | 43.1 | N/A | N/A | N/A |
| West Virginia | 451,498 | 31.2 | U.S. Senate | 124,667 | 27.6 |
| Wisconsin | 2,410,314 | 56.5 | Governor | 137,607 | 5.7 |
| Wyoming | 168,390 | 39.3 | Governor | 52,703 | 33.6 |
Note: Information from the United States Elections Project was last updated on December 16, 2014.
Key deadlines
| Deadline | Event |
|---|---|
| July 10, 2014 | Filing deadline for state offices |
| September 9, 2014 | Primary election |
| November 4, 2014 | General election |
| January 1, 2015 | Inauguration of state executive officers |
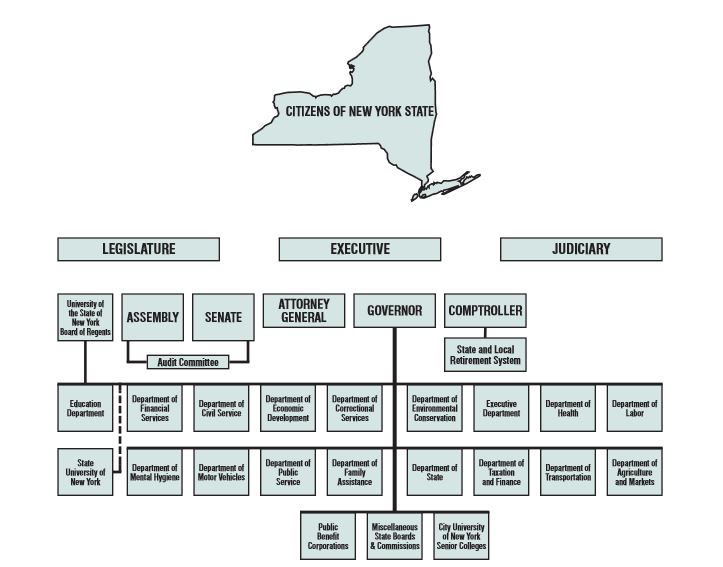
State executive organization
Executive officials in New York are part of a three-pronged government structure that includes state legislators and state judges. The following chart details the relationship among different branches of New York's state government:
Ballotpedia reports
To learn more about developments in these races, check out the following news articles from Ballotpedia:
- New York state executive primary elections review: Andrew Cuomo holds off challenger in Democratic race
- Moreland commission causes controversy for Governor Cuomo
- Filing deadline review: New York state executives primary 2014
Recent news
This section links to a Google news search for the term "New + York + state + executive + elections"
- All stories may not be relevant to this page due to the nature of the search engine.
See also
Footnotes
- ↑ National Conference of State Legislatures, "State Primary Election Types," accessed October 8, 2024
- ↑ New York State Senate, "Consolidated Laws of New York § 17-17-102," accessed October 8, 2024
- ↑ Newsday, "Duffy says departure was his decision; Bellone in the mix for lieutenant governor," May 8, 2014
- ↑ United States Elections Project, "2014 November General Election Turnout Rates," November 7, 2014
- ↑ TIME, "Voter Turnout in Midterm Elections Hits 72-Year Low," November 10, 2014
- ↑ PBS, "2014 midterm election turnout lowest in 70 years," November 10, 2014
- ↑ U.S. News & World Report, "Midterm Turnout Down in 2014," November 5, 2014
| ||||||||||||||||

State of New York Albany (capital) | |
|---|---|
| Elections |
What's on my ballot? | Elections in 2025 | How to vote | How to run for office | Ballot measures |
| Government |
Who represents me? | U.S. President | U.S. Congress | Federal courts | State executives | State legislature | State and local courts | Counties | Cities | School districts | Public policy |