Help us improve in just 2 minutes—share your thoughts in our reader survey.
Missouri school board elections, 2015
| Missouri's 2015 elections School boards • Municipal • Candidate ballot access |
2016 →
← 2014
|
Candidate filing dates • Finance reporting • Poll opening and closing times |
A total of 18 Missouri school districts among America's largest school districts by enrollment held elections in 2015 for 38 seats. All but one of the elections were scheduled on April 7, 2015; a special election for Kansas City Public Schools was held on November 3, 2015.
Here are several quick facts about Missouri's school board elections in 2015:
- The largest school district by enrollment with an election in 2015 was St. Louis Public Schools with 32,364 K-12 students.
- The smallest school district by enrollment with an election in 2015 was Mehlville School District with 10,537 K-12 students.
- Three districts were tied for the most seats on the ballot in 2015 with three seats up for election in each.
- Kansas City Public Schools had the fewest seats on the ballot in 2015 with one up for election.
The district listed below served 307,680 K-12 students during the 2012-2013 school year, according to the National Center for Education Statistics.[1] Click on the district name for more information on the district and its school board elections.
| 2015 Missouri School Board Elections | ||||
|---|---|---|---|---|
| District | Date | Seats up for election | Total board seats | Student enrollment |
| Blue Springs School District | 4/7/2015 | 2 | 7 | 14,203 |
| Columbia Public Schools | 4/7/2015 | 2 | 7 | 17,719 |
| Ferguson-Florissant School District | 4/7/2015 | 2 | 7 | 11,723 |
| Fort Zumwalt R-II School District | 4/7/2015 | 2 | 7 | 18,871 |
| Fox C-6 School District | 4/7/2015 | 2 | 7 | 11,759 |
| Francis Howell School District | 4/7/2015 | 2 | 7 | 19,835 |
| Hazelwood School District | 4/7/2015 | 2 | 7 | 18,325 |
| Lee's Summit R-7 Schools | 4/7/2015 | 2 | 7 | 17,783 |
| Liberty Public Schools | 4/7/2015 | 2 | 7 | 11,549 |
| Mehlville School District | 4/7/2015 | 2 | 7 | 10,537 |
| North Kansas City Schools | 4/7/2015 | 3 | 7 | 19,443 |
| Park Hill School District | 4/7/2015 | 2 | 7 | 10,579 |
| Parkway Schools | 4/7/2015 | 2 | 7 | 16,192 |
| Rockwood School District | 4/7/2015 | 3 | 7 | 20,450 |
| St. Louis Public Schools | 4/7/2015 | 2 | 7 | 32,364 |
| Springfield Public Schools | 4/7/2015 | 3 | 7 | 25,545 |
| Wentzville R-IV School District | 4/7/2015 | 2 | 7 | 13,971 |
| Kansas City Public Schools | 11/3/2015 | 1 | 9 | 16,832 |
Trends in Missouri school board elections
- See also: School boards in session: 2015 in brief
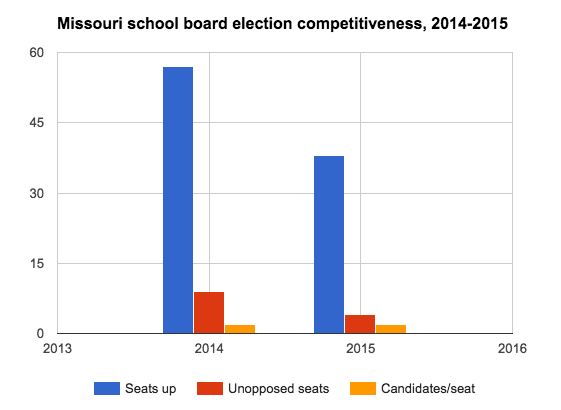
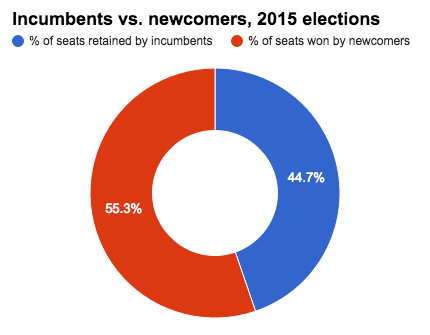
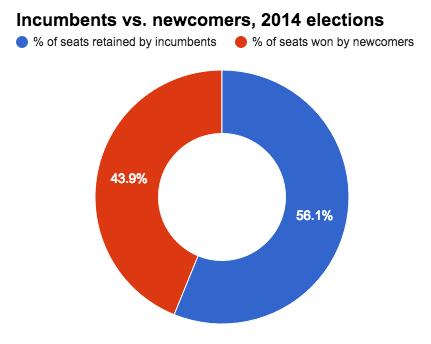
The 2015 school board elections held in Missouri's largest school districts saw more candidates run per seat on the ballot compared to the state's 2014 school board elections. The 2015 elections also had fewer seats go unopposed compared to 2014. Newcomers fared better in 2015 than in 2014. They won 55.26 percent of seats on the ballot in 2015, compared to 43.86 percent in 2014.
The following sections analyze competitiveness and incumbency advantage in Missouri's school board elections. These districts did not utilize primary or runoff elections. Winners only had to receive a plurality, or relative majority, of votes to secure a seat. All of the school board elections held in the state in 2014 and 2015 were nonpartisan.
Details of the data discussed here can be found in the table below.
Competitiveness
In 2015, Missouri's largest school district elections garnered an average of 1.92 candidates per seat up for election. This was an increase from the state's average of 1.86 candidates per seat in the 2014 elections. The state's 2015 school board elections also had a smaller percentage of unopposed seats than it had in 2014. A total of 10.53 percent of seats attracted no opposition in 2015, compared to 15.79 percent in the state's 2014 elections.
Incumbency advantage
|
A total of 73.91 percent of incumbents who ran to retain their seats won re-election in 2015. Twenty-three of the 38 incumbents whose seats were on the ballot ran to keep their seats, and 17 of them won. Two of those winners ran unopposed; the other 15 defeated challengers to win additional terms. In 2014, 85.71 percent of incumbents who ran for re-election retained their seats. A total of 37 of the 57 incumbents who were up for re-election ran to keep their seats, and 32 of them were re-elected. Eight of those winners ran unopposed; the other 24 defeated challengers to keep their seats. The map below details the success rates for incumbents who ran in the 2015 school board elections that were held in the largest school districts by enrollment in the U.S.
|
  |
Data table
The table below displays the statistics for school board elections in Missouri's largest school districts from 2014 to 2015.
| Missouri school board elections, 2014-2015 | ||||||||||
|---|---|---|---|---|---|---|---|---|---|---|
| Year | Total | Incumbents | ||||||||
| Seats up | Candidates | Candidates/ seat |
Unopposed seats | % unopposed | % seats won by newcomers | Sought re-election | Unopposed | Retained | % retained | |
| 2015 | 38 | 73 | 1.92 | 4 | 10.53% | 55.26% | 23 | 2 | 17 | 73.91% |
| 2014 | 57 | 106 | 1.86 | 9 | 15.79% | 43.86% | 37 | 8 | 32 | 85.71% |
Spotlight districts
Missouri saw legislative efforts to create a system for school board recall elections following controversies in Fox C-6 School District and St. Joseph School District.
Fox C-6 School District

In September 2014, allegations were made that former Superintendent Dianne Critchlow misspent district funds during her tenure. These allegations included claims that she booked a $1,000-per-night hotel room while attending a conference in Orlando, Fla., in February 2013. According to a "You Paid For It" investigation by FOX 2, "The rate was dropped to $550 per night when they showed up for the conference later that June. That still far exceeded the $110 limit set by school district policy." While the district has tried to recover money from Critchlow, the district's spending has also come under investigation by the Missouri State Auditor.[2]
The superintendent spending controversy spurred Rep. Rob Vescovo (R-112) to introduce HB 1180 to create a process for school board recalls. Missouri had no statewide provisions allowing the recall of school board members. Vescovo's proposed law was written to allow recalls in any school district that had a board of seven members, had an enrollment between 11,500 and 12,000 in the 2013-2014 school year and is located in a county with a charter form of government with a population between 200,000 and 350,000. It also provided that any vacancies created by such recall elections would be filled by the county executive.[3]
Fox C-6 was not the only school district with a scandal to spur interest in developing a school board recall process in 2015. Sen. Rob Schaaf (R-34) introduced SB 473 earlier in 2015 in response to the ongoing scandal in the St. Joseph School District.
Survey responses
Four of the 71 candidates running for a school board seat in Missouri's largest school districts in the 2015 elections responded to Ballotpedia's school board candidate survey. The following sections display their answers to questions about top priorities and education issues.
Top priorities

When asked what his top priority would be if elected, Ron Fedorchak, former incumbent on the Mehlville Board of Education, stated:
| “ | Balancing the budget. Facility improvement and maintenance. Classroom technology. Student contact time and balanced calendar.[4] | ” |
| —Ron Fedorchak (2015)[5] | ||

Kyle Haubrich, challenger in the Mehlville Board of Education election, responded with this statement:
| “ | The financial condition of the district is the most important issue. Uncertainty surrounding the finances has a ripple effect throughout the entire system, negatively affecting the classroom, teachers, administration & the community in general. We must regain sound financial footing in order to address the challenges ahead.[4] | ” |
| —Kyle Haubrich (2015)[6] | ||

Rockwood Board of Education challenger Lawrence Lazar stated the following as his top priorities:
| “ | 1. Kids First: The primary objective of a school is to help prepare students for the next level, whatever that might be. Giving our children the opportunity to prosper and thrive, regardless of their individual differences, will always be my highest priority. 2. Support for a Learning Environment: I support efforts to develop a learning environment that maximizes student potential. This requires the right curriculum, time for educator development, right sized classrooms and overall support from administrators and the community. I’ll partner in creating learning environments that speak to all students. |
” |
| —Lawrence Lazar (2015)[7] | ||

Michael Spiroff, challenger in the Wentzville R-IV Board of Education election, said his top priorities would be:
| “ | My top priority is to coordinate efforts to control the growth in the Wentzville School District. Controlled growth is imperative in order to optimize the wishes of every parent, teacher, union, taxpayer, and administrator concerned with the outcome of this election. Control the growth and, in turn, improve the financial and operational resources for everyone involved. The current environment requires bond measures or tax levies to help with the explosive growth; however, this only serves as a short-term solution until the next bond issue or tax levy, if the growth continues unchecked. In other words, Propositions F, G, H, & I will face more and more resistance to the point the community feels the increase in taxes outweighs the benefit. The long-term solution is controlled growth. Just as the Federal Reserve lowers and raises interest rates to stimulate and control growth, respectively, the mayors of the cities within the Wentzville School District can do the same. For instance, one approach is a dynamic builder’s tax on new construction. Increase the builder’s tax to slow growth. Decrease the builder’s tax to stimulate growth. Since July 2013, there have been 27 new subdivisions platted within the District. In my view, the Wentzville School Board must hold the superintendent and local leaders accountable for cooperative measures to control the growth at a pace best suited for the District and city infrastructure as a whole.[4] | ” |
| —Michael Spiroff (2015)[8] | ||
Ranking the issues
The candidates were asked to rank the following issues by importance in the school district, with 1 being the most important and 7 being the least important. This table displays the candidates' average rankings as well as the highest and lowest rankings for each issue.
| Issue importance ranking | |||
|---|---|---|---|
| Issues | Average ranking | Highest ranking | Lowest ranking |
| Expanding arts education | 5.25 | 3 | 7 |
| Expanding career-technical education | 4.25 | 2 | 6 |
| Balancing or maintaining the district's budget | 1.75 | 1 | 4 |
| Improving college readiness | 1.75 | 1 | 2 |
| Closing the achievement gap | 3.75 | 3 | 5 |
| Improving education for special needs students | 4.75 | 4 | 6 |
| Expanding school choice options | 6.5 | 5 | 7 |
Positions on the issues
The candidates were asked an additional 10 short answer and multiple choice questions regarding significant issues in education. Links to those responses can be found below.
- Ron Fedorchak survey responses
- Kyle Haubrich survey responses
- Lawrence Lazar survey responses
- Michael Spiroff survey responses
State profile
| Demographic data for Missouri | ||
|---|---|---|
| Missouri | U.S. | |
| Total population: | 6,076,204 | 316,515,021 |
| Land area (sq mi): | 68,742 | 3,531,905 |
| Race and ethnicity** | ||
| White: | 82.6% | 73.6% |
| Black/African American: | 11.5% | 12.6% |
| Asian: | 1.8% | 5.1% |
| Native American: | 0.4% | 0.8% |
| Pacific Islander: | 0.1% | 0.2% |
| Two or more: | 2.4% | 3% |
| Hispanic/Latino: | 3.9% | 17.1% |
| Education | ||
| High school graduation rate: | 88.4% | 86.7% |
| College graduation rate: | 27.1% | 29.8% |
| Income | ||
| Median household income: | $48,173 | $53,889 |
| Persons below poverty level: | 18.2% | 11.3% |
| Source: U.S. Census Bureau, "American Community Survey" (5-year estimates 2010-2015) Click here for more information on the 2020 census and here for more on its impact on the redistricting process in Missouri. **Note: Percentages for race and ethnicity may add up to more than 100 percent because respondents may report more than one race and the Hispanic/Latino ethnicity may be selected in conjunction with any race. Read more about race and ethnicity in the census here. | ||
Presidential voting pattern
- See also: Presidential voting trends in Missouri
Missouri voted Republican in all seven presidential elections between 2000 and 2024.
More Missouri coverage on Ballotpedia
- Elections in Missouri
- United States congressional delegations from Missouri
- Public policy in Missouri
- Endorsers in Missouri
- Missouri fact checks
- More...
Academic performance
| Education terms |
|---|
| For more information on education policy terms, see this article. |
- See also: Public education in Missouri
NAEP scores
- See also: NAEP scores by state
The National Center for Education Statistics provides state-by-state data on student achievement levels in mathematics and reading in the National Assessment of Educational Progress (NAEP). The chart below presents the percentage of fourth and eighth grade students that scored at or above proficient in reading and math during the 2012-2013 school year. Students in Missouri scored about the same as those in Arkansas and Illinois, but slightly lower than students in Iowa. The best scores in the state were earned by fourth graders in math, with 39 percent scoring at or above proficient.[9]
| Percent of students scoring at or above proficient, 2012-2013 | ||||
|---|---|---|---|---|
| Math - Grade 4 | Math - Grade 8 | Reading - Grade 4 | Reading - Grade 8 | |
| Missouri | 39% | 33% | 35% | 36% |
| Arkansas | 39% | 28% | 32% | 30% |
| Illinois | 39% | 36% | 34% | 36% |
| Iowa | 48% | 36% | 38% | 37% |
| United States | 41% | 34% | 34% | 34% |
| Source: United States Department of Education, ED Data Express, "State Tables" | ||||
Graduation, ACT and SAT scores
The following table shows the graduation rates and average composite ACT and SAT scores for Missouri and surrounding states during the 2012-2013 school year. All statements made in this section refer to that school year.[9][10][11]
In the United States, public schools reported graduation rates that averaged to about 81.4 percent. About 54 percent of all students in the country took the ACT, while 50 percent reported taking the SAT. The average national composite scores for those tests were 20.9 out of a possible 36 for the ACT and 1,498 out of a possible 2,400 for the SAT.[12]
Missouri schools reported a graduation rate of 85.7 percent during the 2012-2013 school year, which was second-highest among its neighboring states.
In Missouri, more students took the ACT than the SAT in 2013, earning an average ACT score of 21.6.
| Comparison table for graduation rates and test scores, 2012-2013 | |||||||
|---|---|---|---|---|---|---|---|
| State | Graduation rate, 2013 | Average ACT composite, 2013 | Average SAT composite, 2013 | ||||
| Percent | Quintile ranking** | Score | Participation rate | Score | Participation rate | ||
| Missouri | 85.7% | Second | 21.6 | 74% | 1,773 | 4% | |
| Arkansas | 84.9% | Second | 20.2 | 90% | 1,697 | 4% | |
| Illinois | 83.2% | Third | 20.6 | 100% | 1,807 | 5% | |
| Iowa | 89.7% | First | 22.1 | 66% | 1,763 | 3% | |
| United States | 81.4% | 20.9 | 54% | 1498 | 50% | ||
| **Graduation rates for states in the first quintile ranked in the top 20 percent nationally. Similarly, graduation rates for states in the fifth quintile ranked in the bottom 20 percent nationally. Sources: United States Department of Education, "ED Data Express" ACT.org, "2013 ACT National and State Scores" The Commonwealth Foundation, "SAT scores by state, 2013" | |||||||
Dropout rate
- See also: Public high school dropout rates by state for a full comparison of dropout rates by group in all states
The high school event dropout rate indicates the proportion of students who were enrolled at some time during the school year and were expected to be enrolled in grades 9–12 in the following school year but were not enrolled by October 1 of the following school year. Students who have graduated, transferred to another school, died, moved to another country, or who are out of school due to illness are not considered dropouts. The average public high school event dropout rate for the United States remained constant at 3.3 percent for both school year 2010–11 and school year 2011–12. The event dropout rate for Missouri was higher than the national average at 3.4 percent in the 2010-2011 school year. The dropout rate was lower than the national average at 2.9 percent in the 2011-2012 school year.[13]
See also
| Missouri | School Boards | News and Analysis |
|---|---|---|
 |
 | |
Footnotes
- ↑ National Center for Education Statistics, "Elementary/Secondary Information System," accessed April 20, 2015
- ↑ Fox 2, "Former FOX C-6 superintendents spending called into question," September 24, 2014
- ↑ Missouri House of Representatives, "HB 1180," accessed March 12, 2015
- ↑ 4.0 4.1 4.2 4.3 Note: This text is quoted verbatim from the original source. Any inconsistencies are attributable to the original source.
- ↑ Ballotpedia School Board Candidate Survey, 2015, "Ron Fedorchak responses," March 26, 2015
- ↑ Ballotpedia School Board Candidate Survey, 2015, "Kyle Haubrich responses," March 27, 2015
- ↑ Ballotpedia School Board Candidate Survey, 2015, "Lawrence Lazar responses," March 29, 2015
- ↑ Ballotpedia School Board Candidate Survey, 2015, "Michael Spiroff responses," March 27, 2015
- ↑ 9.0 9.1 United States Department of Education, ED Data Express, "State Tables," accessed May 13, 2014
- ↑ ACT, "2012 ACT National and State Scores," accessed May 13, 2014
- ↑ Commonwealth Foundation, "SAT Scores by State 2013," October 10, 2013
- ↑ StudyPoints, "What's a good SAT score or ACT score?" accessed June 7, 2015
- ↑ United States Department of Education, National Center for Education Statistics, "Common Core of Data (CCD), State Dropout and Graduation Rate Data File, School Year 2010-11, Provision Version 1a and School Year 2011-12, Preliminary Version 1a," accessed May 13, 2014
| |||||