Help us improve in just 2 minutes—share your thoughts in our reader survey.
Minnesota school board elections, 2015
| Minnesota's 2015 elections School boards • Municipal • Candidate ballot access |
2016 →
← 2014
|
Candidate filing dates • Finance reporting • Poll opening and closing times |
A total of nine Minnesota school districts among America's largest school districts by enrollment held elections for 33 seats on November 3, 2015.
Here are several quick facts about Minnesota's school board elections in 2015:
- The largest school district by enrollment with an election in 2015 was Anoka-Hennepin School District with 38,467 K-12 students.
- The smallest school district by enrollment with an election in 2015 was Eden Prairie Schools with 9,402 K-12 students.
- Six districts were tied for the most seats on the ballot in 2015 with four seats up for election in each district.
- The remaining three districts tied for the fewest seats on the ballot in 2015 with three seats up for election in each district.
The districts listed below served 172,892 K-12 students during the 2012-2013 school year, according to the National Center for Education Statistics.[1] Click on the district names for more information on the district and its school board elections.
| 2015 Minnesota School Board Elections | ||||
|---|---|---|---|---|
| District | Date | Seats up for election | Total board seats | Student enrollment |
| Anoka-Hennepin School District | 11/3/2015 | 3 | 6 | 38,467 |
| Bloomington Public Schools | 11/3/2015 | 3 | 7 | 10,501 |
| Eden Prairie Schools | 11/3/2015 | 4 | 7 | 9,402 |
| Minnetonka School District | 11/3/2015 | 4 | 7 | 9,596 |
| Mounds View Public Schools | 11/3/2015 | 4 | 7 | 10,431 |
| Rosemount-Apple Valley-Eagan Public Schools | 11/3/2015 | 4 | 7 | 27,243 |
| Saint Paul Public Schools | 11/3/2015 | 4 | 7 | 38,419 |
| South Washington County Schools | 11/3/2015 | 3 | 7 | 18,048 |
| Wayzata Public Schools | 11/3/2015 | 4 | 7 | 10,785 |
Trends in Minnesota school board elections
- See also: School boards in session: 2015 in brief
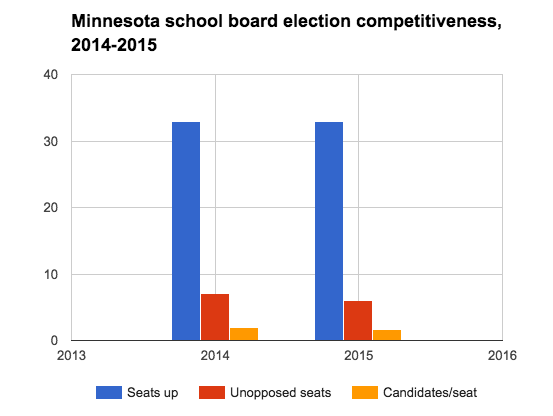
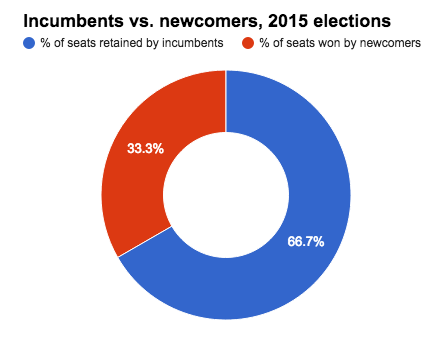
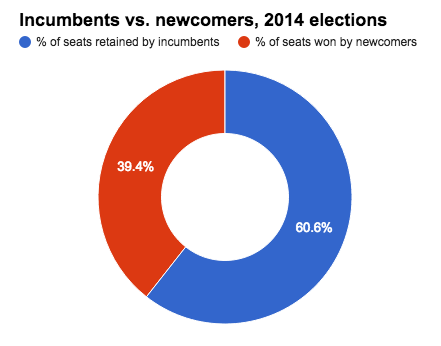
The 2015 school board elections in Minnesota's largest school districts attracted fewer candidates per seat than the state's 2014 school board elections did. Despite having fewer candidates, however, the 2015 elections had a smaller percentage of seats go unopposed than the 2014 elections had. Newcomers fared better in the 2014 elections. They won exactly one-third of the seats that were on the ballot in 2015, compared to 39.39 percent of the seats on the ballot in 2014.
The following sections analyze competitiveness and incumbency advantage in Minnesota's school board elections. These districts did not utilize primary or runoff elections. Winners only had to receive a plurality, or relative majority, of votes to secure a seat. All of the school board elections held in the state in 2014 and 2015 were nonpartisan.
Details of the data discussed here can be found in the table below.
Competitiveness
In 2015, 56 candidates ran for the 33 school board seats up for election in Minnesota's largest school districts, which came to an average of 1.70 candidates per seat. The 2014 elections also had 33 school board seats on the ballot, but a total of 66 candidates sought those seats, which came to an average of two candidates per seat. Six seats—18.18 percent—went unopposed in 2015, compared to the seven seats, or 21.21 percent, that were unopposed in 2014.
Incumbency advantage
|
Nearly all—95.65 percent—of the incumbents who ran for re-election in 2015 retained their seats. Twenty-three of the 33 incumbents whose terms were up for election ran to keep their seats, and 22 of them won. Four of those winning incumbents ran unopposed; the others defeated challengers to win additional terms. In 2014, 86.96 percent of incumbents who ran to retain their seats won re-election. Twenty-three of the 33 incumbents whose terms were on the ballot ran to keep their seats, and 20 of them won. Five of those winners ran unopposed; the other 15 won re-election by defeating challengers. The map below details the success rates for incumbents who ran in the 2015 school board elections that were held in the largest school districts by enrollment in the U.S.
|
  |
Data table
The table below displays the statistics for school board elections in Minnesota's largest school districts from 2014 to 2015.
| Minnesota school board elections, 2014-2015 | ||||||||||
|---|---|---|---|---|---|---|---|---|---|---|
| Year | Total | Incumbents | ||||||||
| Seats up | Candidates | Candidates/ seat |
Unopposed seats | % unopposed | % seats won by newcomers | Sought re-election | Unopposed | Retained | % retained | |
| 2015 | 33 | 56 | 1.70 | 6 | 18.18% | 33.33% | 23 | 4 | 22 | 95.65% |
| 2014 | 33 | 66 | 2.00 | 7 | 21.21% | 39.39% | 23 | 5 | 20 | 86.96% |
Survey responses
Five of the 56 candidates running for a school board seat in Minnesota's largest school districts in the 2015 elections responded to Ballotpedia's school board candidate survey. The following sections display their answers to questions about top priorities and education issues.
Top priorities
When asked what his top priorities would be if elected, Murshid Barud, challenger on the Eden Prairie Schools Board of Education, stated:
| “ | Closing the achievement gap[2] | ” |
| —Murshid Barud (2015)[3] | ||

The top priority of Greg Lehman, winner of a seat on the Eden Prairie Schools Board of Education, was:
| “ | The achievement gap.[2] | ” |
| —Greg Lehman (2015)[4] | ||

Mary Vanderwert, winner of a seat on the Saint Paul Public Schools Board of Education, said the following were her top priorities:
| “ | I believe that the organizational culture of the St. Paul Public Schools needs to be improved. We need a school board, staff, parents and administration that have a common vision for the direction of the schools and are willing to work together toward those goals. While some school sites have really effective, positive cultures, it is inconsistent across the city. Culture comes from the leadership of an organization and we want one that is collaborative, creative, supportive and exciting. We need a culture that values the contributions of staff and provides them a voice in decision-making. With a healthy culture focused on the mission and with effective leadership, we can make SPPS the best school district in this country.[2] | ” |
| —Mary Vanderwert (2015)[5] | ||

When asked what her top priorities would be if elected, Patricia Driscoll, challenger of a seat on the South Washington County School Board, stated:
| “ | Financial stability.[2] | ” |
| —Patricia Driscoll (2015)[6] | ||

The top priorities of Michelle Witte, incumbent on the South Washington County School Board, were:
| “ | Ensure educators have the resources they need to serve our students, through passage of our levy referendums, and budgeting driven by evidence of what supports student achievement; To recruit and retain excellence in our workforce through support of more competitive compensation, professional development, and efforts to diversify; Support curriculum re-design that meets changing student needs.[2] | ” |
| —Michelle Witte (2015)[7] | ||
Ranking the issues
The candidates were asked to rank the following issues by importance in the school district, with 1 being the most important and 7 being the least important. This table displays the candidates' average rankings as well as the highest and lowest rankings for each issue.
| Issue importance ranking | |||
|---|---|---|---|
| Issues | Average ranking | Highest ranking | Lowest ranking |
| Expanding arts education | 5.60 | 5 | 7 |
| Expanding career-technical education | 4.40 | 3 | 6 |
| Balancing or maintaining the district's budget | 2.20 | 1 | 4 |
| Improving college readiness | 3.80 | 3 | 6 |
| Closing the achievement gap | 1.40 | 1 | 2 |
| Improving education for special needs students | 4.20 | 2 | 7 |
| Expanding school choice options | 6.40 | 5 | 7 |
Positions on the issues
The candidates were asked an additional 10 short answer and multiple choice questions regarding significant issues in education. Links to those responses can be found below.
- Murshid Barud survey responses
- Greg Lehman survey responses
- Mary Vanderwert survey responses
- Patricia Driscoll survey responses
- Michelle Witte survey responses
State profile
| Demographic data for Minnesota | ||
|---|---|---|
| Minnesota | U.S. | |
| Total population: | 5,482,435 | 316,515,021 |
| Land area (sq mi): | 79,627 | 3,531,905 |
| Race and ethnicity** | ||
| White: | 84.8% | 73.6% |
| Black/African American: | 5.5% | 12.6% |
| Asian: | 4.4% | 5.1% |
| Native American: | 1% | 0.8% |
| Pacific Islander: | 0% | 0.2% |
| Two or more: | 2.7% | 3% |
| Hispanic/Latino: | 5% | 17.1% |
| Education | ||
| High school graduation rate: | 92.4% | 86.7% |
| College graduation rate: | 33.7% | 29.8% |
| Income | ||
| Median household income: | $61,492 | $53,889 |
| Persons below poverty level: | 12.2% | 11.3% |
| Source: U.S. Census Bureau, "American Community Survey" (5-year estimates 2010-2015) Click here for more information on the 2020 census and here for more on its impact on the redistricting process in Minnesota. **Note: Percentages for race and ethnicity may add up to more than 100 percent because respondents may report more than one race and the Hispanic/Latino ethnicity may be selected in conjunction with any race. Read more about race and ethnicity in the census here. | ||
Presidential voting pattern
- See also: Presidential voting trends in Minnesota
Minnesota voted for the Democratic candidate in all seven presidential elections between 2000 and 2024.
Pivot Counties (2016)
Ballotpedia identified 206 counties that voted for Donald Trump (R) in 2016 after voting for Barack Obama (D) in 2008 and 2012. Collectively, Trump won these Pivot Counties by more than 580,000 votes. Of these 206 counties, 19 are located in Minnesota, accounting for 9.22 percent of the total pivot counties.[8]
Pivot Counties (2020)
In 2020, Ballotpedia re-examined the 206 Pivot Counties to view their voting patterns following that year's presidential election. Ballotpedia defined those won by Trump won as Retained Pivot Counties and those won by Joe Biden (D) as Boomerang Pivot Counties. Nationwide, there were 181 Retained Pivot Counties and 25 Boomerang Pivot Counties. Minnesota had 15 Retained Pivot Counties and four Boomerang Pivot Counties, accounting for 8.29 and 16.00 percent of all Retained and Boomerang Pivot Counties, respectively.
More Minnesota coverage on Ballotpedia
- Elections in Minnesota
- United States congressional delegations from Minnesota
- Public policy in Minnesota
- Endorsers in Minnesota
- Minnesota fact checks
- More...
Academic performance
| Education terms |
|---|
| For more information on education policy terms, see this article. |
- See also: Public education in Minnesota
NAEP scores
- See also: NAEP scores by state
The National Center for Education Statistics provides state-by-state data on student achievement levels in mathematics and reading in the National Assessment of Educational Progress (NAEP). The chart below presents the percentage of fourth and eighth grade students that scored at or above proficient in reading and math during the 2012-2013 school year. Compared to three neighboring states (North Dakota, South Dakota, and Wisconsin), Minnesota's fourth and eighth graders earned the highest scores across the board.[9]
| Percent of students scoring at or above proficient, 2012-2013 | ||||
|---|---|---|---|---|
| Math - Grade 4 | Math - Grade 8 | Reading - Grade 4 | Reading - Grade 8 | |
| Minnesota | 59% | 47% | 41% | 41% |
| North Dakota | 48% | 41% | 34% | 34% |
| South Dakota | 40% | 38% | 32% | 36% |
| Wisconsin | 47% | 40% | 35% | 36% |
| United States | 41% | 34% | 34% | 34% |
| Source: United States Department of Education, ED Data Express, "State Tables" | ||||
Graduation, ACT and SAT scores
The following table shows the graduation rates and average composite ACT and SAT scores for Minnesota and surrounding states during the 2012-2013 school year. All statements made in this section refer to that school year.[9][10][11]
In the United States, public schools reported graduation rates that averaged to about 81.4 percent. About 54 percent of all students in the country took the ACT, while 50 percent reported taking the SAT. The average national composite scores for those tests were 20.9 out of a possible 36 for the ACT and 1,498 out of a possible 2,400 for the SAT.[12]
Minnesota schools reported a graduation rate of 79.8 percent during the 2012-2013 school year, lowest among its neighboring states.
In Minnesota, more students took the ACT than the SAT in 2013, earning an average ACT score of 23.
| Comparison table for graduation rates and test scores, 2012-2013 | |||||||
|---|---|---|---|---|---|---|---|
| State | Graduation rate, 2013 | Average ACT composite, 2013 | Average SAT composite, 2013 | ||||
| Percent | Quintile ranking** | Score | Participation rate | Score | Participation rate | ||
| Minnesota | 79.8% | Fourth | 23 | 74% | 1,780 | 6% | |
| North Dakota | 87.5% | First | 20.5 | 98% | 1,799 | 2% | |
| South Dakota | 82.7% | Third | 21.9 | 78% | 1,760 | 3% | |
| Wisconsin | 88% | First | 22.1 | 71% | 1,771 | 4% | |
| United States | 81.4% | 20.9 | 54% | 1498 | 50% | ||
| **Graduation rates for states in the first quintile ranked in the top 20 percent nationally. Similarly, graduation rates for states in the fifth quintile ranked in the bottom 20 percent nationally. Sources: United States Department of Education, "ED Data Express" ACT.org, "2013 ACT National and State Scores" The Commonwealth Foundation, "SAT scores by state, 2013" | |||||||
Dropout rate
- See also: Public high school dropout rates by state for a full comparison of dropout rates by group in all states
The high school event dropout rate indicates the proportion of students who were enrolled at some time during the school year and were expected to be enrolled in grades nine through 12 in the following school year but were not enrolled by October 1 of the following school year. Students who have graduated, transferred to another school, died, moved to another country, or who are out of school due to illness are not considered dropouts. The average public high school event dropout rate for the United States remained constant at 3.3 percent for both school year 2010–2011 and school year 2011–2012. The event dropout rate for Minnesota was lower than the national average at 1.8 percent in the 2010-2011 school year, and 1.9 percent in the 2011-2012 school year.[13]
See also
| Minnesota | School Boards | News and Analysis |
|---|---|---|
 |
 | |
|
Footnotes
- ↑ National Center for Education Statistics, "Elementary/Secondary Information System," accessed April 20, 2015
- ↑ 2.0 2.1 2.2 2.3 2.4 Note: This text is quoted verbatim from the original source. Any inconsistencies are attributable to the original source.
- ↑ Ballotpedia's school board candidate survey, 2015, Murshid Barud's responses, September 25, 2015
- ↑ Ballotpedia's school board candidate survey, 2015, Greg Lehman's responses, September 28, 2015
- ↑ Ballotpedia School Board Candidate Survey, 2015, "Mary Vanderwert Responses," October 5, 2015
- ↑ Ballotpedia School Board Candidate Survey, 2015, "Patricia Driscoll Responses," September 25, 2015
- ↑ Ballotpedia School Board Candidate Survey, 2015, "Michelle Witte Responses," October 3, 2015
- ↑ The raw data for this study was provided by Dave Leip of Atlas of U.S. Presidential Elections.
- ↑ 9.0 9.1 United States Department of Education, ED Data Express, "State Tables," accessed May 13, 2014
- ↑ ACT, "2012 ACT National and State Scores," accessed May 13, 2014
- ↑ Commonwealth Foundation, "SAT Scores by State 2013," October 10, 2013
- ↑ StudyPoints, "What's a good SAT score or ACT score?" accessed June 7, 2015
- ↑ United States Department of Education, National Center for Education Statistics, "Common Core of Data (CCD), State Dropout and Graduation Rate Data File, School Year 2010-11, Provision Version 1a and School Year 2011-12, Preliminary Version 1a," accessed May 13, 2014
| |||||