Help us improve in just 2 minutes—share your thoughts in our reader survey.
Massachusetts school board elections, 2015
| Massachusetts's 2015 elections School boards • Municipal • Candidate ballot access |
2016 →
← 2014
|
Candidate filing dates • Finance reporting • Poll opening and closing times |
A total of nine Massachusetts school districts among America's largest school districts by enrollment held elections for 51 seats on November 3, 2015.
Here are several quick facts about Massachusetts's school board elections in 2015:
- The largest school district by enrollment with an election in 2015 was Worcester Public Schools with 24,740 K-12 students.
- The smallest school district by enrollment with an election in 2015 was Quincy Public Schools with 9,266 K-12 students.
- Newton Public Schools had the most seats on the ballot in 2015 with eight seats up for election.
- Quincy Public Schools and New Bedford Public Schools tied for the fewest seats on the ballot in 2015 with three seats up for election in both districts.
The districts listed below served 126,853 K-12 students during the 2012-2013 school year, according to the National Center for Education Statistics.[1] Click on the district names for more information on the district and its school board elections.
| 2015 Massachusetts School Board Elections | ||||
|---|---|---|---|---|
| District | Date | Seats up for election | Total board seats | Student enrollment |
| Brockton Public Schools | 11/3/2015 | 7 | 7 | 16,595 |
| Fall River Public Schools | 11/3/2015 | 6 | 7 | 10,138 |
| Lawrence Public Schools | 11/3/2015 | 6 | 7 | 13,145 |
| Lowell Public Schools | 11/3/2015 | 6 | 7 | 13,879 |
| Lynn Public Schools | 11/3/2015 | 6 | 7 | 14,139 |
| New Bedford Public Schools | 11/3/2015 | 3 | 7 | 12,616 |
| Newton Public Schools | 11/3/2015 | 8 | 9 | 12,335 |
| Quincy Public Schools | 11/3/2015 | 3 | 7 | 9,266 |
| Worcester Public Schools | 11/3/2015 | 6 | 7 | 24,740 |
Trends in Massachusetts school board elections
- See also: School boards in session: 2015 in brief
The 2015 school board elections in the largest school districts in Massachusetts attracted a lower average number of candidates per seat and than the school board elections held in the largest school districts across the United States did. Despite having a lower average number of candidates, the state also had a lower percentage of unopposed seats compared to the country as a whole. Newcomers fared better in school board elections held across the country than they did in Massachusetts. They won one-third of the seats on the ballot in Massachusetts, compared to 40.77 percent of seats up for election in the United States.
The following sections analyze competitiveness and incumbency advantage in Massachusetts' school board elections. One district held primary elections for some of its seats. In the other districts, winners only had to receive a plurality, or relative majority, of votes to secure a seat. All of the school board elections held in the state in 2015 were nonpartisan.
Details of the data discussed here can be found in the table below.
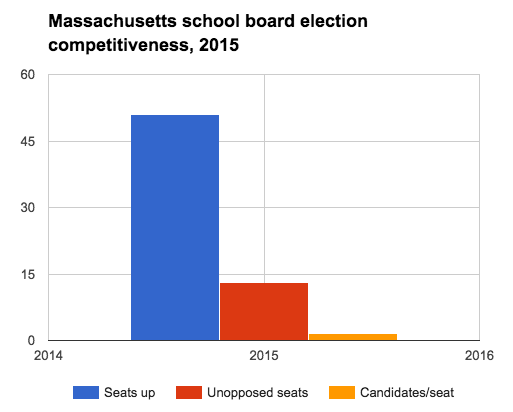
Competitiveness
In 2015, an average of 1.49 candidates ran per seat up for election in the largest school districts in Massachusetts. An average of 1.72 candidates ran per seat in elections held in the largest school districts nationwide. A total of 25.49 percent of school board seats in Massachusetts were unopposed. This was lower than the 35.97 percent of seats that were unopposed across the country.
Incumbency advantage
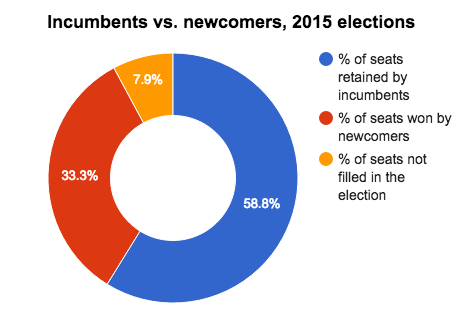
A total of 85.71 percent of incumbents who ran for re-election in 2015 in Massachusetts retained their seats. Thirty-five of the 51 incumbents whose terms were up for election ran to keep their seats, and 30 of them won. Ten of those winners ran unopposed; the other 20 defeated challengers to win additional terms.
A total of 82.66 percent of incumbents kept their seats in school board elections across the country, and 40.45 percent of them ran unopposed. The map below details the success rates for incumbents who ran in the 2015 school board elections that were held in the largest school districts by enrollment in the U.S.
The map above details the success rates of incumbent who ran to retain their school board seats in the largest school districts in each state. States depicted in gray did not hold school board elections. |
Data table
The table below displays the statistics for school board elections in Massachusetts' largest school districts in 2015.
| Massachusetts school board elections, 2015 | ||||||||||
|---|---|---|---|---|---|---|---|---|---|---|
| Year | Total | Incumbents | ||||||||
| Seats up | Candidates | Candidates/ seat |
Unopposed seats | % unopposed | % seats won by newcomers | Sought re-election | Unopposed | Retained | % retained | |
| 2015 | 51 | 76 | 1.49 | 13 | 25.49% | 33.33% | 35 | 10 | 30 | 85.71% |
Spotlight districts
Worcester Public Schools
School safety debate
Student arrests at two district schools in April 2015 spurred a conversation about school safety that crossed over into the 2015 board elections. On April 29, 2015, five students at Worcester Technical High School were arrested for carrying knives and a pellet gun near the school. Another incident on the same day involved police monitoring of a Burncoat High School student and another person fleeing the property and dropping a handgun during their escape.[2] The city responded to the incidents on April 30 by stationing police officers in all five high schools for the remainder of the 2014-2015 school year.[3] The district experienced 40 weapon incidents during that school year along with 36 assaults on students.[4]
These incidents triggered a discussion of new security measures in schools including a city council proposal to add metal detectors to high school entrances. Worcester Police Chief Gary Gemme discussed crime from surrounding neighborhoods filtering into schools in the wake of the April 2015 incidents. Following the arrests, Superintendent Melinda Boone noted that district schools were safe but that all solutions would be reviewed to prevent similar problems in the future.[3] Robert Pezzella, the district's school safety liaison, concluded from his previous safety audits that better communications between schools and city officials were needed.[5] The city commissioned an audit of safety issues at 15 district schools by Good Harbor Techmark in September 2015. The audit had an estimated cost of $84,281 with a projected publication date of November 30, 2015.[6][7]
The City of Worcester experienced a smaller decline in violent crimes from 2009 to 2013 compared to other large cities in Massachusetts. Worcester's total number of violent crimes decreased 2.2 percent during that period, according to the Federal Bureau of Investigation's annual Crime in the United States report. This rate was lower than the decline for Boston (18.6 percent), Springfield (13.2 percent), Lowell (47.5 percent) and Cambridge (27.3 percent). The following table traces the violent crime rates from 2009 to 2013 for the state's five largest cities by population.[8]
Candidate positions on school safety
The dialogue between school board candidates in 2015 has been defined in part by the school safety discussion. The following box summarizes the positions of each candidate on school safety as discussed in candidate forums, interviews and posts on campaign websites.
| Candidate stances on school safety | |
|---|---|
| Candidate | Stated position |
| Dianna Biancheria | Improve communication between school committee and other stakeholders, input from principals and staff members on future safety plans[9] |
| John L. Foley | Increase presence of school resource officers[10] |
| John F. Monfredo | Support for police grant to connect schools to emergency services[11] |
| Brian A. O'Connell | Improve school environment by enforcing disciplinary rules, follow recommendations of audit[12] |
| Tracy A. O'Connell Novick | Opposed to police presence in schools, review recommendations of audit[13] |
| Hilda Ramirez | Engagement of parents in the district, increased number of after-school and summer programs[12] |
| Donna M. Colorio | Greater involvement and more funding for safety by school committee[14] |
| Cotey Collins | Support for more police in schools and metal detectors[15] |
| Nicola D'Andrea | Expedite safety audit, create school-by-school plans, public input on plans[16] |
| Molly McCullough | Continued evaluation of police presence in schools, consistent safety standards[15] |
Survey responses
Six of the 76 candidates running for a school board seat in Massachusetts' largest school districts in the 2015 elections responded to Ballotpedia's school board candidate survey. The following sections display their answers to questions about top priorities and education issues.
Top priorities
When asked what his top priorities would be if elected, Raymond Henningson, Jr., incumbent on the Brockton Public Schools School Committee, stated:
| “ | Advocating for parents issues.[17] | ” |
| —Raymond Henningson, Jr. (2015)[18] | ||

The top priorities of Melissa Karam Panchley, incumbent on the Fall River Public Schools School Committee, were:
| “ | My top priority is reducing elementary classroom size and adding pre--school slots. If we can give our students a stronger foundation at a young age, the rest will follow.[17] | ” |
| —Melissa Karam Panchley (2015)[19] | ||

Pavel M. Payano, incumbent on the Lawrence Public Schools School Committee, stated the following as his top priorities:
| “ | To ensure that the district gets out of receivership as soon as possible.[17] | ” |
| —Pavel Payano (2015)[20] | ||
When asked what his top priorities would be if elected, Warley Williams, challenger for a seat on the New Bedford Public Schools School Committee, stated:
| “ | My top priority would be to persuade the Superintendent and Committee to develop a school safety, security, and discipline framework at the middle and high schools.[17] | ” |
| —Warley Williams (2015)[21] | ||
The top priorities of Cyrus Vaghar, challenger for a seat on the Newton Public Schools School Committee, were:
| “ | Solve the drug crises that is affecting our schools and mandate a basic financial literacy course. Right now, students can graduate high school without learning how a credit card works or how to pick a student loan.[17] | ” |
| —Cyrus Vaghar (2015)[22] | ||
John F. Monfredo, incumbent on the Worcester Public Schools School Committee, stated the following as his top priorities:

| “ |
1. SCHOOL SAFETY … we must do everything possible to maintain safety in our schools. ON GRADE LEVEL BY THE END OF GRADE THREE… WE NEED TO STRONGLY ADDRESS THIS ISSUE |
” |
| —John Monfredo (2015)[23] | ||
Ranking the issues
The candidates were asked to rank the following issues by importance in the school district, with 1 being the most important and 7 being the least important. This table displays the candidates' average rankings as well as the highest and lowest rankings for each issue.
| Issue importance ranking | |||
|---|---|---|---|
| Issues | Average ranking | Highest ranking | Lowest ranking |
| Expanding arts education | 4.17 | 1 | 6 |
| Expanding career-technical education | 4.17 | 3 | 6 |
| Balancing or maintaining the district's budget | 1.67 | 1 | 2 |
| Improving college readiness | 4.00 | 2 | 7 |
| Closing the achievement gap | 4.17 | 1 | 7 |
| Improving education for special needs students | 4.83 | 3 | 6 |
| Expanding school choice options | 5.00 | 1 | 7 |
Positions on the issues
The candidates were asked an additional 10 short answer and multiple choice questions regarding significant issues in education. Links to those responses can be found below.
State profile
| Demographic data for Massachusetts | ||
|---|---|---|
| Massachusetts | U.S. | |
| Total population: | 6,784,240 | 316,515,021 |
| Land area (sq mi): | 7,800 | 3,531,905 |
| Race and ethnicity** | ||
| White: | 79.6% | 73.6% |
| Black/African American: | 7.1% | 12.6% |
| Asian: | 6% | 5.1% |
| Native American: | 0.2% | 0.8% |
| Pacific Islander: | 0% | 0.2% |
| Two or more: | 2.9% | 3% |
| Hispanic/Latino: | 10.6% | 17.1% |
| Education | ||
| High school graduation rate: | 89.8% | 86.7% |
| College graduation rate: | 40.5% | 29.8% |
| Income | ||
| Median household income: | $68,563 | $53,889 |
| Persons below poverty level: | 13.1% | 11.3% |
| Source: U.S. Census Bureau, "American Community Survey" (5-year estimates 2010-2015) Click here for more information on the 2020 census and here for more on its impact on the redistricting process in Massachusetts. **Note: Percentages for race and ethnicity may add up to more than 100 percent because respondents may report more than one race and the Hispanic/Latino ethnicity may be selected in conjunction with any race. Read more about race and ethnicity in the census here. | ||
Presidential voting pattern
Massachusetts voted for the Democratic candidate in all seven presidential elections between 2000 and 2024.
More Massachusetts coverage on Ballotpedia
- Elections in Massachusetts
- United States congressional delegations from Massachusetts
- Public policy in Massachusetts
- Endorsers in Massachusetts
- Massachusetts fact checks
- More...
Academic performance
| Education terms |
|---|
| For more information on education policy terms, see this article. |
- See also: Public education in Massachusetts
NAEP scores
- See also: NAEP scores by state
The National Center for Education Statistics provides state-by-state data on student achievement levels in mathematics and reading in the National Assessment of Educational Progress (NAEP). Compared to three neighboring states (Connecticut, New Hampshire, and New York), Massachusetts had the highest share of students (both fourth and eighth graders) who scored at or above proficient in reading during the 2012-2013 school year.[24]
| Percent of students scoring at or above proficient, 2012-2013 | ||||
|---|---|---|---|---|
| Math - Grade 4 | Math - Grade 8 | Reading - Grade 4 | Reading - Grade 8 | |
| Massachusetts | 58% | 55% | 47% | 48% |
| Connecticut | 45% | 37% | 43% | 45% |
| New Hampshire | 59% | 47% | 45% | 44% |
| New York | 40% | 32% | 37% | 35% |
| U.S. averages | 41% | 34% | 34% | 34% |
| Source: United States Department of Education, ED Data Express, "State Tables" | ||||
Graduation, ACT and SAT scores
The following table shows the graduation rates and average composite ACT and SAT scores for Massachusetts and surrounding states during the 2012-2013 school year. All statements made in this section refer to that school year.[24][25][26]
In the United States, public schools reported graduation rates that averaged to about 81.4 percent. About 54 percent of all students in the country took the ACT, while 50 percent reported taking the SAT. The average national composite scores for those tests were 20.9 out of a possible 36 for the ACT and 1,498 out of a possible 2,400 for the SAT.[27]
Massachusetts schools reported a graduation rate of 85 percent during the 2012-2013 school year, second-lowest among its neighboring states
In Massachusetts, more students took the SAT than the ACT in 2013. The students taking the SAT scored an average of 1,553.
| Comparison table for graduation rates and test scores, 2012-2013 | |||||||
|---|---|---|---|---|---|---|---|
| State | Graduation rate, 2013 | Average ACT composite, 2013 | Average SAT composite, 2013 | ||||
| Percent | Quintile ranking** | Score | Participation rate | Score | Participation rate | ||
| Massachusetts | 85% | Second | 24.1 | 22% | 1,553 | 83% | |
| Connecticut | 85.5% | Second | 24 | 27% | 1,532 | 85% | |
| New Hampshire | 87.3% | First | 23.8 | 19% | 1,567 | 70% | |
| New York | 76.8% | Fourth | 23.4 | 26% | 1,463 | 76% | |
| United States | 81.4% | 20.9 | 54% | 1498 | 50% | ||
| **Graduation rates for states in the first quintile ranked in the top 20 percent nationally. Similarly, graduation rates for states in the fifth quintile ranked in the bottom 20 percent nationally. Sources: United States Department of Education, "ED Data Express" ACT.org, "2013 ACT National and State Scores," accessed May 28, 2015 The Commonwealth Foundation, "SAT scores by state, 2013" | |||||||
Dropout rate
- See also: Public high school dropout rates by state for a full comparison of dropout rates by group in all states
The high school event dropout rate indicates the proportion of students who were enrolled at some time during the school year and were expected to be enrolled in grades nine through 12 in the following school year but were not enrolled by October 1 of the following school year. Students who have graduated, transferred to another school, died, moved to another country, or who are out of school due to illness are not considered dropouts. The average public high school event dropout rate for the United States remained constant at 3.3 percent for both school year 2010–2011 and school year 2011–2012. The event dropout rate for Massachusetts was lower than the national average at 2.7 percent in the 2010-2011 school year, and 2.5 percent in the 2011-2012 school year.[28]
See also
| Massachusetts | School Boards | News and Analysis |
|---|---|---|
 |
 | |
|
Footnotes
- ↑ National Center for Education Statistics, "Elementary/Secondary Information System," accessed April 20, 2015
- ↑ MassLive.com, "Students arrested in separate incidents outside Worcester Technical High School and Burncoat High School," April 29, 2015
- ↑ 3.0 3.1 MassLive.com, "Police officers to be added to all Worcester high schools, safety audit planned after recent weapons incidents," April 30, 2015
- ↑ GoLocalWorcester, "Delay in Worcester’s School Safety Audit Raises Concerns of Timing and Transparency," October 6, 2015
- ↑ MassLive.com, "Worcester school safety chief said audit will show need for infrastructure improvements before metal detectors," May 13, 2015
- ↑ MassLive.com, "Worcester school safety audit, prompted by weapons incidents, will cover 15 schools and cost $84K," October 9, 2015
- ↑ Telegram & Gazette, "Worcester picks firm for school security audit," October 9, 2015
- ↑ Federal Bureau of Investigation, "Crime Statistics," accessed October 12, 2015
- ↑ Worcester Magazine, "Superintendent reports on school readiness and safety," August 20, 2015
- ↑ GoLocalWorcester, "Communication of Worcester’s School Safety Plan Questioned by School Committee," August 21, 2015
- ↑ GoLocalWorcester, "Is Student Safety a Major Concern in Worcester Schools?" April 20, 2015
- ↑ 12.0 12.1 GoLocalWorcester, "Is Worcester’s School Safety Being Compromised? City Officials Weigh in," May 15, 2015
- ↑ Telegram & Gazette, "Worcester School Committee candidate: Tracy O'Connell Novick favors hands-on approach," October 12, 2015
- ↑ Telegram & Gazette, "Colorio to run again for Worcester School Committee," May 6, 2015
- ↑ 15.0 15.1 Worcester Magazine, "School Committee hopefuls focus on many issues," June 18, 2015
- ↑ Nick D'Andrea for School Committee, "Worcester School Safety," accessed October 14, 2015
- ↑ 17.0 17.1 17.2 17.3 17.4 17.5 Note: This text is quoted verbatim from the original source. Any inconsistencies are attributable to the original source.
- ↑ Ballotpedia School Board Candidate Survey, 2015, "Raymond Henningson, Jr.'s responses," October 1, 2015
- ↑ Ballotpedia School Board Candidate Survey, 2015, "Melissa Karam Panchley's responses," October 1, 2015
- ↑ Ballotpedia School Board Candidate Survey, 2015, "Pavel Payano's responses," October 5, 2015
- ↑ Ballotpedia School Board Candidate Survey, 2015, "Warley Williams' responses," October 17, 2015
- ↑ Ballotpedia School Board Candidate Survey, 2015, "Cyrus Vaghar's responses," October 6, 2015
- ↑ Ballotpedia School Board Candidate Survey, 2015, "John F. Monfredo's responses," October 5, 2015
- ↑ 24.0 24.1 United States Department of Education, ED Data Express, "State Tables," accessed May 13, 2014
- ↑ ACT, "2012 ACT National and State Scores," accessed May 13, 2014
- ↑ Commonwealth Foundation, "SAT Scores by State 2013," October 10, 2013
- ↑ StudyPoints, "What's a good SAT score or ACT score?" accessed June 7, 2015
- ↑ United States Department of Education, National Center for Education Statistics, "Common Core of Data (CCD), State Dropout and Graduation Rate Data File, School Year 2010-11, Provision Version 1a and School Year 2011-12, Preliminary Version 1a," accessed May 13, 2014
| |||||