Help us improve in just 2 minutes—share your thoughts in our reader survey.
Historical Florida budget and finance information
This article does not contain the most recently published data on this subject. If you would like to help our coverage grow, consider donating to Ballotpedia.
The historical Florida budget and finance information below applies to years prior to the most current fiscal year. With the exception of the tab labeled "Prior fiscal year budgets," the tabs below display information, from several different fiscal years, as it was presented on Ballotpedia in prior calendar years. For more current information regarding Florida's budget and finances, click here.
As published 2016
| Florida budget and finances | |
| General information | |
| Budget calendar: Annual | |
| Fiscal year: 2017 | |
| State credit rating: AAA (as of 2014) | |
| Current governor: Rick Scott | |
| Financial figures | |
| Total spending (state and federal funds): $73.6 billion (estimated for 2014) | |
| Per capita spending: $3,697 (estimated for 2014) | |
| Total state tax collections: $34.6 billion (2013) | |
| Per capita tax collections: $1,765 (2013) | |
| State debt: $197.9 billion (as of 2014) | |
| Per capita state debt: $10,243 (as of 2014) | |
| State budget and finance pages • Total state expenditures • State debt • Tax policy in Florida | |
In Florida, as in other states, lawmakers and public officials are elected in part to manage the state's finances. This includes generating revenues (money coming into the state from various sources) and approving expenditures (the money spent on governmental functions and servicing state debt). State budgets are complex and fluid, as they depend on anticipated revenues and planned expenditures, which may alter over the course of a fiscal year. If revenues do not keep pace with expenditures, states generally have to raise taxes, cut services, borrow money, or a combination of the three. State budget decisions are also influenced by policy decisions at the national level, such as the Affordable Care Act or energy and environmental regulations, and issues at the local level, such as crime and the quality of education.
The Florida state budget and financial data presented here come from different years because the states and the federal government report and publish the information at different times.
Definitions
The following terms are used to describe a state's finances:
- Revenues come mainly from tax collections, licensing fees, federal aid, and returns on investments.
- Expenditures generally include spending on government salaries, infrastructure, education, public pensions, public assistance, corrections, Medicaid, and transportation.
- State debt refers to the money borrowed to make up for a deficit when revenues do not cover spending.
- The state credit rating is the grade given by a credit rating agency based on the general financial health of the state's government and economy.
- State funds include general and other state-based funds. A general fund is "the predominant fund for financing a state's operations." Other state funds are "restricted by law for particular governmental functions or activities."[4]
- Federal funds are "funds received directly from the federal government."[4]
- Total spending is calculated by adding together the totals for state and federal funds used for expenditures.
Revenues
2014 revenues
The table below breaks down state government tax collections by source in 2014 (comparable figures from surrounding states are also provided to give additional context). Figures for all columns except "2013 population" and "Per capita collections" are rendered in thousands of dollars (for example, $2,448 translates to $2,448,000). Figures in the columns labeled "2013 population" and "Per capita collections" have not been abbreviated.[5]
Compared to neighboring states, Florida had the lowest state tax collections per capita, at $1,778.
| State tax collections by source ($ in thousands), 2014 | ||||||||
|---|---|---|---|---|---|---|---|---|
| State | Property taxes | Sales and gross receipts | Licenses | Income taxes | Other taxes | Total | 2013 population | Per capita collections |
| Florida | $250 | $29,046,930 | $2,133,240 | $2,043,750 | $2,160,180 | $35,384,350 | 19,905,569 | $1,778 |
| Alabama | $329,598 | $4,812,674 | $386,378 | $3,612,991 | $152,113 | $9,293,754 | 4,846,411 | $1,918 |
| Georgia | $788,350 | $7,310,132 | $609,944 | $9,909,378 | $10,698 | $18,628,502 | 10,097,132 | $1,845 |
| Mississippi | $25,103 | $4,704,955 | $559,218 | $2,193,646 | $91,593 | $7,574,515 | 2,993,443 | $2,530 |
| South Carolina | $21,664 | $4,628,363 | $471,862 | $3,750,341 | $60,334 | $8,932,564 | 4,829,160 | $1,850 |
| United States | $14,232,835 | $411,414,175 | $51,120,024 | $357,104,785 | $31,880,270 | $865,752,089 | 318,907,401 | $2,715 |
| Source: U.S. Census Bureau, "2014 annual survey of state government tax collections by category," accessed April 4, 2016 | ||||||||
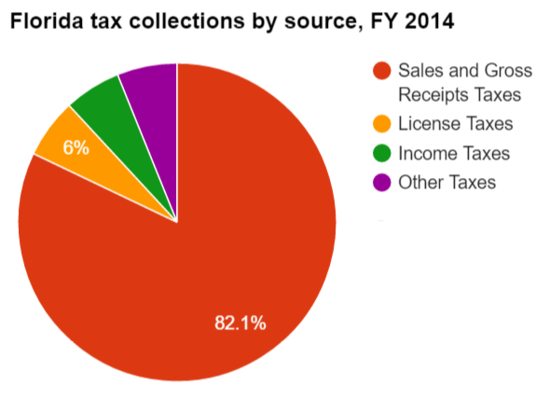
The table below lists 2014 tax collections by source as percentages of total collections. About 82.1 percent of Florida's total state tax collections came from sales and gross receipts.[5]
| State tax collections by source (as percentages), 2014 | |||||
|---|---|---|---|---|---|
| State | Property taxes | Sales and gross receipts | Licenses | Income taxes | Other taxes |
| Florida | 0.0% | 82.1% | 6.0% | 5.8% | 6.1% |
| Alabama | 3.5% | 51.8% | 4.2% | 38.9% | 1.6% |
| Georgia | 4.2% | 39.2% | 3.3% | 53.2% | 0.1% |
| Mississippi | 0.3% | 62.1% | 7.4% | 29.0% | 1.2% |
| South Carolina | 0.2% | 51.8% | 5.3% | 42.0% | 0.7% |
| Source: U.S. Census Bureau, "2014 annual survey of state government tax collections by category," accessed April 4, 2016 | |||||
Federal aid to the state budget
- See also: Federal aid to state budgets
State governments receive aid from the federal government to fund a variety of joint programs, mainly in the form of grants for such things as Medicaid, education, and transportation. In 2013 federal aid to the states accounted for roughly 30 percent of all state general revenues. Federal aid varies from state to state. For example, Mississippi received approximately $7.5 billion in federal aid in 2013, accounting for about 43 percent of the state's general revenues, the highest percentage of all of the states. By contrast, North Dakota received about $1.5 billion in federal aid in 2013, or just 19 percent of the state's general revenues, the lowest percentage in the nation.[6]
The table below notes what share of Florida’s general revenues came from the federal government in 2013. That year, Florida received approximately $23.5 billion in federal aid, 31.5 percent of the state's total general revenues. Taking into consideration the state's 2013 population, this came out to about $1,202 in federal aid per capita. Figures from surrounding states are provided for additional context.[7]
| Federal aid to state budgets, 2013 | |||||
|---|---|---|---|---|---|
| State | Total federal aid ($ in thousands) | Federal aid as a % of general revenues | Ranking (by % of general revenues) | Est. 2013 population | Aid per capita |
| Florida | $23,506,254 | 31.5% | 28 | 19,552,860 | $1,202 |
| Alabama | $8,226,967 | 36.2% | 9 | 4,833,722 | $1,702 |
| Georgia | $14,323,163 | 37.3% | 7 | 9,992,167 | $1,433 |
| Mississippi | $7,509,589 | 42.9% | 1 | 2,991,207 | $2,511 |
| South Carolina | $6,698,952 | 30.2% | 30 | 4,774,839 | $1,403 |
| Sources: United States Census Bureau, "State Government Finances: 2013," accessed April 4, 2016 United States Census Bureau, "State totals: Vintage 2013," accessed April 8, 2016 Note: Per-capita figures were generated by Ballotpedia by dividing total federal aid for the state by the estimated population of that state in 2013. | |||||
Spending
Estimated 2015 expenditures
- See also: Total state expenditures
The table below breaks down estimated spending totals for fiscal year 2015 (comparable figures from surrounding states are included to provide additional context). Figures for all columns except "Population” and “Per capita spending" are rendered in millions of dollars (for example, $2,448 translates to $2,448,000,000). Figures in the columns labeled "Population” and “Per capita spending" have not been abbreviated.[2]
Florida's total estimated government spending in fiscal year 2015 was $75.5 billion, which was the highest amount when compared to surrounding states.
| Total estimated state spending, FY 2015 ($ in millions) | |||||
|---|---|---|---|---|---|
| State | State funds | Federal funds | Total spending | Population | Per capita spending |
| Florida | $50,003 | $25,492 | $75,495 | 20,271,272 | $3,724.24 |
| Alabama | $14,990 | $9,556 | $24,546 | 4,858,979 | $5,051.68 |
| Georgia | $30,593 | $12,901 | $43,494 | 10,214,860 | $4,257.91 |
| Mississippi | $11,481 | $8,953 | $20,434 | 2,992,333 | $6,828.79 |
| South Carolina | $14,926 | $7,631 | $22,557 | 4,896,146 | $4,607.09 |
| Per-capita figures are calculated by taking the state's total spending and dividing by the number of state residents according to United States Census estimates.[8] Source: National Association of State Budget Officers, "Examining fiscal 2013-2015 state spending," accessed April 4, 2016 | |||||
Spending by function
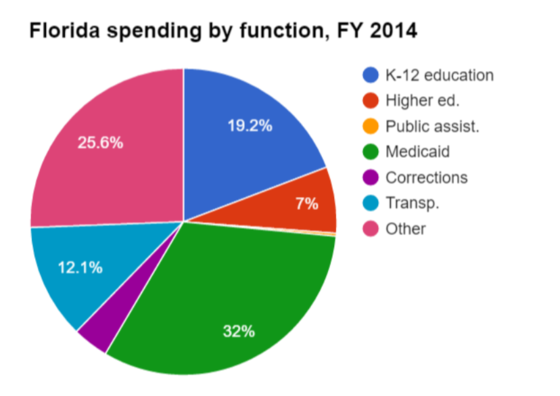
State spending in Florida can be further broken down by function (elementary and secondary education, public assistance, etc.). Fiscal year 2014 information is included in the table below (information from neighboring states is provided for additional context). Figures are rendered as percentages, indicating the share of the total budget spent per category.[2]
In fiscal year 2014, Medicaid accounted for 32 percent of Florida's total expenditures.
| State spending by function as a percent of total expenditures, FY 2014 | |||||||
|---|---|---|---|---|---|---|---|
| State | K-12 education | Higher education | Public assistance | Medicaid | Corrections | Transportation | Other |
| Florida | 19.2% | 7.0% | 0.3% | 32.0% | 3.8% | 12.1% | 25.6% |
| Alabama | 20.5% | 20.6% | 0.2% | 23.3% | 2.4% | 6.4% | 26.6% |
| Georgia | 24.3% | 18.8% | 0.1% | 21.6% | 3.6% | 5.9% | 25.7% |
| Mississippi | 16.3% | 18.9% | 5.5% | 24.6% | 2.0% | 7.1% | 25.5% |
| South Carolina | 18.4% | 23.6% | 0.4% | 24.6% | 2.8% | 6.5% | 23.7% |
| Source: National Association of State Budget Officers Note: "Other" expenditures include "Children's Health Insurance Program (CHIP), institutional and community care for the mentally ill and developmentally disabled, public health programs, employer contributions to pensions and health benefits, economic development, environmental projects, state police, parks and recreation, housing and general aid to local governments."[2] | |||||||
Spending trends
Between 2010 and 2014, the share of the Florida state budget spent on transportation increased from 9.4 percent in 2010 to 12.1 percent in 2014. See the table below for further details (figures are rendered as percentages, indicating the share of the total budget spent per category).[2][9][10]
| Spending by function from 2010 to 2014 (as percentages) | |||||||
|---|---|---|---|---|---|---|---|
| Year | K-12 education | Higher education | Public assistance | Medicaid | Corrections | Transportation | Other |
| 2014 | 19.2% | 7.0% | 0.3% | 32.0% | 3.8% | 12.1% | 25.6% |
| 2013 | 19.3% | 8.5% | 0.3% | 31.8% | 3.9% | 10.9% | 25.4% |
| 2012 | 18.8% | 7.1% | 0.3% | 30.6% | 4.2% | 11% | 28.1% |
| 2011 | 21.8% | 8.2% | 0.3% | 29.2% | 4.4% | 9.6% | 26.7% |
| 2010 | 20.5% | 7.7% | 0.3% | 30.0% | 4.8% | 9.4% | 27.2% |
| Source: National Association of State Budget Officers Note: "Other" expenditures include "Children's Health Insurance Program (CHIP), institutional and community care for the mentally ill and developmentally disabled, public health programs, employer contributions to pensions and health benefits, economic development, environmental projects, state police, parks and recreation, housing and general aid to local governments."[2] | |||||||
Fiscal year budgets
Fiscal year 2016
See budget bill: SB 2500-A
Governor Rick Scott announced his fiscal year 2015 budget proposal on January 28, 2015. Total funding under this proposal totaled about $77 billion, a $93 million decrease from fiscal 2015. General revenue spending would have been $28.3 billion, with education taking about 53.6 percent of that fund. This would have equaled about $19.75 billion in total K-12 spending and included per-pupil spending of about $7,176, the highest in Florida's history. The governor also recommended a zero percent tuition increase in higher education. The budget also proposed $673 million in tax cuts by cutting taxes on cell phones, cable and satellite TV services. Other proposed tax cuts included removing the sales tax on college textbooks and business taxes.[11]
Governor Scott signed the state's fiscal year 2016 budget on June 23, 2015 after several vetoes. The total budget equaled $78.7 billion in spending, $29 billion of which was from general revenue. About $19.7 billion was invested in K-12 education, and $9.3 billion was invested into infrastructure. An additional $4.8 billion was invested in public safety, while also adding funding to the state's Agency of Persons and Disabilities. The budget also included $427 million in tax cuts.[11]
State debt
- See also: State debt
According to a January 2014 report by the nonprofit organization State Budget Solutions, Florida had a state debt of approximately $197.9 billion. Its state debt per capita was $10,243. In this report for fiscal year 2012, state debt was calculated based on four components: "market-valued unfunded public pension liabilities, outstanding government debt, unfunded other post employment benefit (OPEB) liabilities, and outstanding unemployment trust fund loans." The report revealed that altogether state governments faced a combined $5.1 trillion in debt, which amounted to $16,178 per capita in the nation.[12][13]
| Total 2012 state debt | |||
|---|---|---|---|
| State | Total state debt | State debt per capita | Per capita debt ranking |
| Florida | $197,871,611,000 | $10,243 | 43 |
| Alabama | $68,343,597,000 | $14,173 | 26 |
| Georgia | $115,193,862,000 | $11,612 | 39 |
| Mississippi | $54,686,815,000 | $18,321 | 14 |
| South Carolina | $71,105,557,000 | $15,053 | 23 |
| Sources: State Budget Solutions, "State Budget Solutions' Fourth Annual State Debt Report," January 8, 2014 | |||
Taxpayer burden
|
TIA Methodology: To figure a state’s taxpayer burden or surplus, TIA looked at a state’s total reported assets minus capital assets and assets restricted by law (buildings, roads, land, etc.) to calculate “available assets,” which were then compared to the amount of money the state owes in bills, including retirement obligations such as pension plans and healthcare benefits for retirees. If the difference between available assets and total bills was positive, TIA called this a surplus; if it was negative, this was a burden. This amount was then divided by the number of individual tax returns with a positive tax liability, thus expressing the total state surplus or burden on a per-taxpayer basis. |
According to a report released in September 2015 by the nonprofit Truth in Accounting (TIA), Florida ranked 12th best in the country in “taxpayer burden.” Rather than using per capita state debt, TIA ranked states based on what it called a “taxpayer burden,” a term that reflects “the amount each taxpayer would have to send to their state’s treasury in order for the state to be debt-free.” On the other hand, states that had sufficient resources to pay their bills were said to have a “taxpayer surplus,” which represents the amount that each taxpayer would receive if the state were to disburse its excess funds.
Based on analysis of Florida’s Comprehensive Annual Financial Report from June 30, 2014 and actuarial reports for the state’s retirement plans, TIA concluded that $11.3 billion in promised retirement benefits were unfunded, but only $1.8 billion of these liabilities were reported on Florida’s balance sheet. With all of the unfunded retirement benefits included in the total debt, the state had a shortfall of $6.4 billion, or a taxpayer burden of $1,100.[14]
Public pensions
- See also: Florida public pensions and Florida public employee salaries
Between fiscal years 2008 and 2012, the funded ratio of Florida's state-administered pension plans decreased from 105.3 percent to 86.4 percent. The state paid 59 percent of its annual required contribution, and for fiscal year 2012 the pension system's unfunded accrued liability totaled $20.1 billion. This amounted to $1,089 in unfunded liabilities per capita.[15][16]
Credit ratings
- See also: State credit ratings
Credit rating agencies, such as Standard and Poor's, assign grades to states that take into account a state's ability to pay debts and the general health of the state's economy. Generally speaking, a higher credit rating indicates lower interest costs on the general obligation bonds states sometimes sell to investors in order to finance large-scale undertakings (e.g., road construction and other public works projects). This in turn results in lower interest costs, thereby lowering the cost to taxpayers.[17][18]
The table below lists the Standard and Poor's credit ratings for Florida and surrounding states from 2004 to 2014. Standard and Poor's grades range from AAA, the highest available, to BBB, the lowest.[19]
| State credit ratings, 2004 to 2014 | |||||||||||
|---|---|---|---|---|---|---|---|---|---|---|---|
| State | 2014 | 2013 | 2012 | 2011 | 2010 | 2009 | 2008 | 2007 | 2006 | 2005 | 2004 |
| Florida | AAA | AAA | AAA | AAA | AAA | AAA | AAA | AAA | AAA | AAA | AA+ |
| Alabama | AA | AA | AA | AA | AA | AA | AA | AA | AA | AA | AA |
| Georgia | AAA | AAA | AAA | AAA | AAA | AAA | AAA | AAA | AAA | AAA | AAA |
| Mississippi | AA | AA | AA | AA | AA | AA | AA | AA | AA | AA | AA |
| South Carolina | AA+ | AA+ | AA+ | AA+ | AA+ | AA+ | AA+ | AA+ | AA+ | AA+ | AAA |
| Source: Stateline: The Daily News Service of The Pew Charitable Trusts, "Infographic: S&P State Credit Ratings, 2001-2014," June 9, 2014 | |||||||||||
Economic indicators
- See also: Economic indicators by state
Broadly defined, a healthy economy is typically one that has a "stable and strong rate of economic growth" (gross state product, in this case) and low unemployment, among many other factors. The economic health of a state can significantly affect its healthcare costs, insurance coverage, access to care, and citizens' physical and mental health. For instance, during economic downturns, employers may reduce insurance coverage for employees, while those who are laid off may lose coverage altogether. Individuals also tend to spend less on non-urgent care or postpone visits to the doctor when times are hard. These changes in turn may affect the decisions made by policymakers as they react to shifts in the industry. Additionally, a person's socioeconomic status has profound effects on their access to care and the quality of care received.[20][21][22]
In 2013, compared to its neighboring state, Florida had the largest percentage of residents that earned incomes of at least 400 percent above the federal poverty level. Between 2011 and 2013, the state's median annual household income was $47,106, just below that in Georgia. Florida's unemployment rate in September 2014 was lowest among its neighboring states at 6.1 percent.[23][24][25][26]
Note: Gross state product (GSP) on its own is not necessarily an indicator of economic health; GSP may also be influenced by state population size. Many factors must be looked at together to assess state economic health.
| Various economic indicators by state | ||||||||
|---|---|---|---|---|---|---|---|---|
| State | Distribution of population by FPL* (2013) | Median annual income (2011-2013) | Unemployment rate | Total GSP (2013)† | ||||
| Under 100% | 100-199% | 200-399% | 400%+ | Sept. 2013 | Sept. 2014 | |||
| Florida | 15% | 20% | 32% | 32% | $47,106 | 6.9% | 6.1% | $800,492 |
| Alabama | 17% | 22% | 33% | 28% | $43,330 | 6.4% | 6.6% | $193,566 |
| Georgia | 16% | 21% | 32% | 31% | $47,753 | 8% | 7.9% | $454,532 |
| Mississippi | 23% | 20% | 29% | 28% | $40,338 | 8.4% | 7.7% | $105,163 |
| United States | 15% | 19% | 30% | 36% | $52,047 | 7.2% | 5.9% | $16,701,415 |
| * Federal Poverty Level. "The U.S. Census Bureau's poverty threshold for a family with two adults and one child was $18,751 in 2013. This is the official measurement of poverty used by the Federal Government." † Median annual household income, 2011-2013. ‡ In millions of current dollars. "Gross State Product is a measurement of a state's output; it is the sum of value added from all industries in the state." Source: The Henry J. Kaiser Family Foundation, "State Health Facts" | ||||||||
Budget process
The state operates on an annual budget cycle. The sequence of key events in the budget process is as follows:[27]
- In June or July, the governor sends budget instructions to state agencies.
- In September or October, agencies submit their budget requests to the governor.
- Budget hearings are held with the public from October through February.
- The governor submits his or her proposed budget to the state legislature 30 days before the legislature convenes.
- The legislature adopts a budget in March, April, or May, effective for the fiscal year beginning on July 1. A simple majority is required to pass a budget.
The governor is statutorily required to submit a balanced budget to the legislature. In turn, the legislature must pass a balanced budget, and any budget signed into law by the governor must be balanced.[27]
Florida is one of 44 states in which the governor has line item veto authority.[27][28]
Florida budgets three major funds: the General Fund, the Major Special Revenue Fund, and the Special Revenue Fund. Both the Major Special Revenue Fund and the Special Revenue Fund are composed of lesser funds. The Major Special Revenue Fund is composed of three lesser funds, and the Special Revenue Fund is composed of about 19 to 20 lesser funds.[29]
Agencies, offices, and committees
The following standing committees in the Florida State Legislature deal with budget and finance matters:
- Appropriations Committee, Florida House of Representatives
- Appropriations Committee, Florida State Senate
- Finance & Tax Committee, Florida House of Representatives
- Finance and Tax Committee, Florida State Senate
- Fiscal Policy Committee, Florida State Senate
- Joint Legislative Budget Commission, Florida State Legislature
The Florida Chief Financial Officer performs the duties typical of state treasurers and controllers by providing accounting services, managing and performing audits of the state's finances, and overseeing payroll for state employees. The position is elected ever four years in midterm elections years and is a partisan office.
Transparency
- See also: "Following the Money" report, 2015
The U.S. Public Interest Research Group, a consumer-focused nonprofit organization based in Washington, D.C., released its annual report on state transparency websites in March 2015. The report, entitled "Following the Money," measured how transparent and accountable state websites were with regard to state government spending.[30] According to the report, Florida received a grade of A and a numerical score of 95, indicating that Florida was "Leading" in terms of transparency regarding state spending.[30]
As published 2015
|
The information on this tab contains:
|
Between fiscal years 2013 and 2014, total spending in Florida increased by approximately $3.6 billion, from $70 billion in fiscal year 2013 to an estimated $73.6 billion in 2014. This represents a 5.1 percent increase. The cumulative rate of inflation during the same period was 1.58 percent, calculated using the Consumer Price Indices for January 2013 and January 2014. As of 2014, financial services firm Standard and Poor's had assigned Florida a credit rating of AAA.[31][32][33]
Spending
Definitions
The following terms are used to describe a state's finances:
- Revenues come mainly from tax collections, licensing fees, federal aid, and returns on investments.
- Expenditures generally include spending on government salaries, infrastructure, education, public pensions, public assistance, corrections, Medicaid, and transportation.
- State debt refers to the money borrowed to make up for a deficit when revenues do not cover spending.
- The state credit rating is the grade given by a credit rating agency based on the general financial health of the state's government and economy.
- State funds include general and other state-based funds. A general fund is "the predominant fund for financing a state's operations." Other state funds are "restricted by law for particular governmental functions or activities."[4]
- Federal funds are "funds received directly from the federal government."[4]
- Total spending is calculated by adding together the totals for state and federal funds used for expenditures.
2014 expenditures
- See also: Total state expenditures
The table below breaks down estimated spending totals for fiscal year 2014 (comparable figures from surrounding states are included to provide additional context). Figures for all columns except "Population” and “Per capita spending" are rendered in millions of dollars (for example, $2,448 translates to $2,448,000,000). Figures in the columns labeled "Population” and “Per capita spending" have not been abbreviated.[33]
Total estimated spending in Florida amounted to $73.6 billion, highest among its neighboring states. Florida's estimated per capita spending was lowest among its neighbors at $3,697.
| Total estimated state spending, FY 2014 ($ in millions) | |||||
|---|---|---|---|---|---|
| State | State funds | Federal funds | Total spending | Population | Per capita spending |
| Florida | $48,135 | $25,416 | $73,551 | 19,893,297 | $3,697.28 |
| Alabama | $14,605 | $9,288 | $23,893 | 4,849,377 | $4,927.02 |
| Georgia | $29,545 | $11,834 | $41,379 | 10,097,343 | $4,098.01 |
| Mississippi | $10,479 | $8,197 | $18,676 | 2,994,079 | $6,237.64 |
| South Carolina | $14,445 | $6,993 | $21,438 | 4,832,482 | $4,436.23 |
| Per-capita figures are calculated by taking the state's total spending and dividing by the number of state residents according to United States Census Bureau estimates.[34] Source: National Association of State Budget Officers | |||||
Spending by function
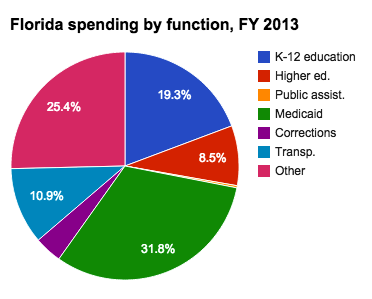
State spending in Florida can be further broken down by function (elementary and secondary education, public assistance, etc.). Fiscal year 2013 information is included in the table below (information from neighboring states is provided for additional context). Figures are rendered as percentages, indicating the share of the total budget spent per category.[33]
Florida dedicated the bulk of its budget in 2013 to Medicaid at 31.8 percent, a larger percentage of any of its neighboring states.
| State spending by function as a percent of total expenditures, FY 2013 | |||||||
|---|---|---|---|---|---|---|---|
| State | K-12 education | Higher education | Public assistance | Medicaid | Corrections | Trans- portation |
Other |
| Florida | 19.3% | 8.5% | 0.3% | 31.8% | 3.9% | 10.9% | 25.4% |
| Alabama | 20.4% | 19.9% | 0.2% | 22.8% | 2.4% | 6.5% | 27.7% |
| Georgia | 24.1% | 19% | 0.1% | 21.3% | 3.7% | 5.7% | 26.2% |
| Mississippi | 16.4% | 16.1% | 5.9% | 26.1% | 2% | 6.7% | 26.7% |
| South Carolina | 17.6% | 19.5% | 0.4% | 22% | 2.7% | 5.4% | 32.4% |
| Source: National Association of State Budget Officers Note: "Other" expenditures include "Children's Health Insurance Program (CHIP), institutional and community care for the mentally ill and developmentally disabled, public health programs, employer contributions to pensions and health benefits, economic development, environmental projects, state police, parks and recreation, housing and general aid to local governments."[33] | |||||||
Spending trends
Between 2009 and 2013, the portion of Florida's budget dedicated to Medicaid rose from 26.2 percent to 31.8 percent. See the table below for further details (figures are rendered as percentages, indicating the share of the total budget spent per category).[33][9][10][35][36]
| Spending by function from 2009 to 2013 (as percentages) | |||||||
|---|---|---|---|---|---|---|---|
| Year | K-12 education | Higher education | Public assistance | Medicaid | Corrections | Transportation | Other |
| 2013 | 19.3% | 8.5% | 0.3% | 31.8% | 3.9% | 10.9% | 25.4% |
| 2012 | 18.8% | 7.1% | 0.3% | 30.6% | 4.2% | 11% | 28.1% |
| 2011 | 21.8% | 8.2% | 0.3% | 29.2% | 4.4% | 9.6% | 26.7% |
| 2010 | 20.5% | 7.7% | 0.3% | 30.0% | 4.8% | 9.4% | 27.2% |
| 2009 | 19.5% | 9.3% | 0.3% | 26.2% | 4.9% | 9.9% | 29.8% |
| Source: National Association of State Budget Officers Note: "Other" expenditures include "Children's Health Insurance Program (CHIP), institutional and community care for the mentally ill and developmentally disabled, public health programs, employer contributions to pensions and health benefits, economic development, environmental projects, state police, parks and recreation, housing and general aid to local governments."[33] | |||||||
Revenues
2013 revenues
The table below breaks down state government tax collections by source in 2013 (comparable figures from surrounding states are also provided to give additional context). Figures for all columns except "Population" and "Per capita revenue" are rendered in thousands of dollars (for example, $2,448 translates to $2,448,000). Figures in the columns labeled "Population" and "Per capita revenue" have not been abbreviated.[5]
Florida's total tax collections in 2013 amounted to $34.6 billion, highest among its neighboring states. Florida's per capita tax collections were lower than any of its neighboring states at $1,765.
| State tax collections by source ($ in thousands) | |||||||||
|---|---|---|---|---|---|---|---|---|---|
| State | Property taxes | Sales and gross receipts | Licenses | Individual income taxes | Corporation net income taxes | Other taxes | Total | 2013 population | Per capita collections |
| Florida | $360 | $28,526,653 | $1,993,965 | N/A | $2,071,710 | $1,995,790 | $34,588,478 | 19,600,311 | $1,764.69 |
| Alabama | $322,300 | $4,707,375 | $490,475 | $3,202,520 | $382,202 | $161,597 | $9,266,469 | 4,833,996 | $1,916.94 |
| Georgia | $61,052 | $7,408,422 | $744,401 | $8,772,227 | $797,255 | $10,795 | $17,794,152 | 9,994,759 | $1,780.35 |
| Mississippi | $24,122 | $4,571,294 | $530,010 | $1,755,424 | $415,980 | $105,895 | $7,402,725 | 2,992,206 | $2,474.00 |
| South Carolina | $8,549 | $4,476,982 | $439,843 | $3,357,518 | $386,669 | $51,744 | $8,721,305 | 4,771,929 | $1,827.63 |
| Source: Tax Policy Center, "State Tax Collection Sources 2000-2013," June 20, 2014 | |||||||||

The table below lists 2013 tax collections by source as percentages of total collections. Sales taxes and gross receipts accounted for the vast majority of tax collections in Florida, amounting to 82.5 percent of total collections.[5]
| State tax collections by source (as percentages) | ||||||
|---|---|---|---|---|---|---|
| State | Property taxes | Sales and gross receipts | Licenses | Individual income taxes | Corporation net income taxes | Other taxes |
| Florida | 0.0% | 82.47% | 5.76% | N/A | 5.99% | 5.77% |
| Alabama | 3.48% | 50.8% | 5.29% | 34.56% | 4.12% | 1.74% |
| Georgia | 0.34% | 41.63% | 4.18% | 49.3% | 4.48% | 0.06% |
| Mississippi | 0.33% | 61.75% | 7.16% | 23.71% | 5.62% | 1.43% |
| South Carolina | 0.1% | 51.33% | 5.04% | 38.5% | 4.43% | 0.59% |
| Source: Tax Policy Center, "State Tax Collection Sources 2000-2013," June 20, 2014 | ||||||
State debt
- See also: State debt
According to a January 2014 report by the nonprofit organization State Budget Solutions, Florida had a state debt of approximately $197.9 billion. Its state debt per capita was $10,243. In this report for fiscal year 2012, state debt was calculated based on four components: "market-valued unfunded public pension liabilities, outstanding government debt, unfunded other post employment benefit (OPEB) liabilities, and outstanding unemployment trust fund loans." The report revealed that altogether state governments faced a combined $5.1 trillion in debt, which amounted to $16,178 per capita in the nation.[37][38]
| Total 2012 state debt | |||
|---|---|---|---|
| State | Total state debt | State debt per capita | Per capita debt ranking |
| Florida | $197,871,611,000 | $10,243 | 43 |
| Alabama | $68,343,597,000 | $14,173 | 26 |
| Georgia | $115,193,862,000 | $11,612 | 39 |
| Mississippi | $54,686,815,000 | $18,321 | 14 |
| South Carolina | $71,105,557,000 | $15,053 | 23 |
| Sources: State Budget Solutions, "State Budget Solutions' Fourth Annual State Debt Report," January 8, 2014 | |||
Public pensions
- See also: Florida public pensions and Florida public employee salaries
Between fiscal years 2008 and 2012, the funded ratio of Florida's state-administered pension plans decreased from 105.3 percent to 86.4 percent. The state paid 59 percent of its annual required contribution, and for fiscal year 2012 the pension system's unfunded accrued liability totaled $20.1 billion. This amounted to $1,089 in unfunded liabilities per capita.[15][39]
Credit ratings
- See also: State credit ratings
Credit rating agencies, such as Standard and Poor's, assign grades to states that take into account a state's ability to pay debts and the general health of the state's economy. Generally speaking, a higher credit rating indicates lower interest costs on the general obligation bonds states sometimes sell to investors in order to finance large-scale undertakings (e.g., road construction and other public works projects). This in turn results in lower interest costs, thereby lowering the cost to taxpayers.[17][40]
The table below lists the Standard and Poor's credit ratings for Florida and surrounding states from 2004 to 2014. Standard and Poor's grades range from AAA, the highest available, to BBB, the lowest.[41]
| State credit ratings, 2004 to 2014 | |||||||||||
|---|---|---|---|---|---|---|---|---|---|---|---|
| State | 2014 | 2013 | 2012 | 2011 | 2010 | 2009 | 2008 | 2007 | 2006 | 2005 | 2004 |
| Florida | AAA | AAA | AAA | AAA | AAA | AAA | AAA | AAA | AAA | AAA | AA+ |
| Alabama | AA | AA | AA | AA | AA | AA | AA | AA | AA | AA | AA |
| Georgia | AAA | AAA | AAA | AAA | AAA | AAA | AAA | AAA | AAA | AAA | AAA |
| Mississippi | AA | AA | AA | AA | AA | AA | AA | AA | AA | AA | AA |
| South Carolina | AA+ | AA+ | AA+ | AA+ | AA+ | AA+ | AA+ | AA+ | AA+ | AA+ | AAA |
| Source: Stateline: The Daily News Service of The Pew Charitable Trusts, "Infographic: S&P State Credit Ratings, 2001-2014," June 9, 2014 | |||||||||||
Federal aid to the state budget
- See also: Federal aid to state budgets
State governments receive aid from the federal government to fund a variety of joint programs, such as Medicaid. Federal aid varies from state to state. For example, Mississippi received approximately $7.7 billion in federal aid in 2012, which accounted for more than 45 percent of the state's general revenues. By contrast, Alaska received roughly $2.9 billion in federal aid in 2012, just under 20 percent of the state's general revenues.[7]
The table below notes what share of Florida’s general revenues came from the federal government in 2012. That year, Florida received approximately $22.9 billion in federal aid, 31.7 percent of the state's total general revenues. Figures from surrounding states are provided for additional context.[7]
| Federal aid to state budgets, 2012 | |||
|---|---|---|---|
| State | Total federal aid ($ in thousands) | Federal aid as a % of general revenue | Ranking |
| Florida | $22,850,620 | 31.7% | 30 |
| Alabama | $8,112,509 | 36.5% | 9 |
| Georgia | $13,794,726 | 37.92% | 7 |
| Mississippi | $7,725,294 | 45.35% | 1 |
| South Carolina | $6,892,660 | 32.41% | 28 |
| Source: United States Census Bureau, "State Government Finances: 2012," accessed February 24, 2014 | |||
Stimulus
According to Recovery.gov, the official government website for the Recovery Accountability and Transparency Board, under the American Recovery and Reinvestment Act, Florida received $9.8 billion in federal stimulus funding between February 2009 and June 2013.[42] The state also received $1.3 billion from the federal government under H.R. 1586, a $26 billion plan to give states money for Medicaid and education that President Obama signed into law on August 10, 2010.[43]
Budget process
The state operates on an annual budget cycle. The sequence of key events in the budget process is as follows:[27]
- In June or July, the governor sends budget instructions to state agencies.
- In September or October, agencies submit their budget requests to the governor.
- Budget hearings are held with the public from October through February.
- The governor submits his or her proposed budget to the state legislature 30 days before the legislature convenes.
- The legislature adopts a budget in March, April, or May, effective for the fiscal year beginning on July 1. A simple majority is required to pass a budget.
The governor is statutorily required to submit a balanced budget to the legislature. In turn, the legislature must pass a balanced budget, and any budget signed into law by the governor must be balanced.[27]
Florida is one of 44 states in which the governor has line item veto authority.[27][44]
Florida budgets three major funds: the General Fund, the Major Special Revenue Fund, and the Special Revenue Fund. Both the Major Special Revenue Fund and the Special Revenue Fund are composed of lesser funds. The Major Special Revenue Fund is composed of three lesser funds, and the Special Revenue Fund is composed of about 19 to 20 lesser funds.[45]
Agencies, offices, and committees
The following standing committees in the Florida State Legislature deal with budget and finance matters:
- Appropriations Committee, Florida House of Representatives
- Appropriations Committee, Florida State Senate
- Finance & Tax Committee, Florida House of Representatives
- Finance and Tax Committee, Florida State Senate
- Fiscal Policy Committee, Florida State Senate
- Joint Legislative Budget Commission, Florida State Legislature
The Florida Chief Financial Officer performs the duties typical of state treasurers and controllers by providing accounting services, managing and performing audits of the state's finances, and overseeing payroll for state employees. The position is elected ever four years in midterm elections years and is a partisan office.
Studies and reports
U.S. PIRG "Following the Money" report
- See also: "Following the Money" report, 2014
The U.S. Public Interest Research Group, a consumer-focused nonprofit organization based in Washington, D.C., released its annual report on state transparency websites in April 2014. The report, entitled "Following the Money," measured the transparency and accountability of state websites with regard to state government spending.[46] According to the report, Florida received a grade of A- and a numerical score of 92.5, indicating that Florida was leading in terms of transparency regarding state spending.[46]
As published 2014
|
The information on this tab contains:
|
Between fiscal year 2009 and fiscal year 2013, Florida's total expenditures increased by approximately $7.9 billion, from $62.1 billion in 2009 to nearly $70 billion in 2013. This represented an 11.3 percent increase, outpacing the cumulative rate of inflation during the same period (9.06 percent, calculated using the Consumer Price Indices for January 2009 and January 2013).[47][48]
Spending
Definitions
Although each state executes its budget process differently, the National Association of State Budget Officers (NASBO) breaks down state expenditures into four general categories. This allows for comparisons among the 50 states. NASBO's categories are as follows:[49]
- General fund: "The predominant fund for financing a state’s operations. Revenues are received from broad-based state taxes. However, there are differences in how specific functions are financed from state to state."[49]
- Other funds: "Expenditures from revenue sources that are restricted by law for particular governmental functions or activities. For example, a gasoline tax dedicated to a highway trust fund would appear in the 'Other funds' column. For Medicaid, other state funds include provider taxes, fees, donations, assessments, and local funds."[49]
- Federal funds: "Funds received directly from the federal government."[49]
- Bonds: "Expenditures from the sale of bonds, generally for capital projects."[49]
2013
2013 expenditures
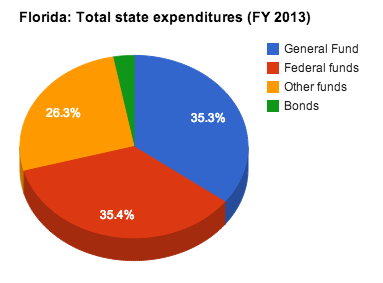
The table below breaks down expenditures for fiscal year 2013 (comparable figures from surrounding states are provided to give additional context).[49] Figures for all columns except "Per capita expenditures" are rendered in millions of dollars (for example, $2,448 translates to $2,448,000,000). Figures in the column labeled "Per capita expenditures" have not been abbreviated.
| Total state expenditures, FY 2013 ($ in millions)[49] | |||||||
|---|---|---|---|---|---|---|---|
| State | General fund | Federal funds | Other funds | Bonds | Total | Per capita expenditures** | |
| Florida | $24,717 | $24,737 | $18,437 | $2,084 | $69,975 | $3,578.76 | |
| Alabama | $6,897 | $9,541 | $7,490 | $189 | $24,117 | $4,989.32 | |
| Georgia | $18,303 | $11,752 | $10,211 | $808 | $41,074 | $4,110.62 | |
| Mississippi | $4,699 | $8,274 | $5,660 | $784 | $19,417 | $6,491.36 | |
| South Carolina | $6,350 | $7,792 | $8,158 | $0 | $22,300 | $4,670.31 | |
| **Per capita figures are calculated by taking the state's total expenditures and dividing by the number of state residents according to United States Census estimates.[50] Source: National Association of State Budget Officers | |||||||
Spending by function
2012
Source: National Association of State Budget Officers
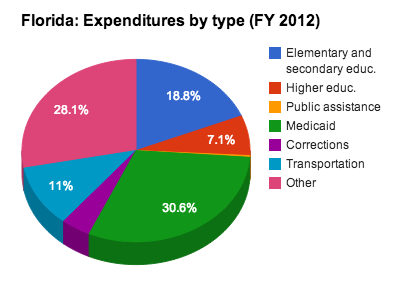
State expenditures in Florida can be further broken down by function (elementary and secondary education, public assistance, etc.). Fiscal year 2012 data is included in the table below (information from neighboring states is provided for additional context). Figures are rendered as percentages, indicating the share of the total budget spent per category.
| Expenditures by function, FY 2012 (as percentages)[49] | |||||||
|---|---|---|---|---|---|---|---|
| State | Elementary and secondary ed. | Higher ed. | Public assistance | Medicaid | Corrections | Transportation | Other |
| Florida | 18.8% | 7.1% | 0.3% | 30.6% | 4.2% | 11% | 28.1% |
| Alabama | 20.9% | 20.1% | 0.2% | 23.3% | 2.5% | 6.1% | 27% |
| Georgia | 24.0% | 18.7% | 0.1% | 21.5% | 3.7% | 5.2% | 26.8% |
| Mississippi | 16.9% | 16.8% | 5.8% | 23.4% | 1.8% | 7.5% | 27.7% |
| South Carolina | 15.9% | 21.0% | 0.4% | 21.7% | 2.7% | 6.6% | 31.7% |
| Source: National Association of State Budget Officers Note: "Other" expenditures include "Children's Health Insurance Program (CHIP), institutional and community care for the mentally ill and developmentally disabled, public health programs, employer contributions to pensions and health benefits, economic development, environmental projects, state police, parks and recreation, housing and general aid to local governments."[49] | |||||||
Spending trends
The largest shift in expenditure trends was a 7.4 percentage point increase between 2008 and 2012 in Medicaid expenditures, which represented a 31.9 percent increase in the share of the budget. During the same period, education expenditures for both elementary and secondary education as well as higher education fell by 1.4 percentage points, a 6.9 percent decrease in the share of the budget, and 2.8 percentage points, a 28.3 percent decrease in the share of the budget, respectively. The table below details changes in expenditures from 2008 to 2012.[49][9][10][35][36]
Figures are rendered as percentages, indicating the share of the total budget spent per category.
| Expenditures from 2008 to 2012 (as percentages) | |||||||
|---|---|---|---|---|---|---|---|
| Year | Elementary and secondary ed. | Higher ed. | Public assistance | Medicaid | Corrections | Transportation | Other |
| 2012 | 18.8% | 7.1% | 0.3% | 30.6% | 4.2% | 11% | 28.1% |
| 2011 | 21.8% | 8.2% | 0.3% | 29.2% | 4.4% | 9.6% | 26.7% |
| 2010 | 20.5% | 7.7% | 0.3% | 30.0% | 4.8% | 9.4% | 27.2% |
| 2009 | 19.5% | 9.3% | 0.3% | 26.2% | 4.9% | 9.9% | 29.8% |
| 2008 | 20.2% | 9.9% | 0.2% | 23.2% | 4.8% | 10.7% | 31% |
| Change in % | -1.4% | -2.8% | 0.1% | 7.4% | -0.6% | 0.3% | -2.9% |
| Source: National Association of State Budget Officers Note: "Other" expenditures include "Children's Health Insurance Program (CHIP), institutional and community care for the mentally ill and developmentally disabled, public health programs, employer contributions to pensions and health benefits, economic development, environmental projects, state police, parks and recreation, housing and general aid to local governments."[49] | |||||||
Revenues
2013 revenues
Source: National Association of State Budget Officers
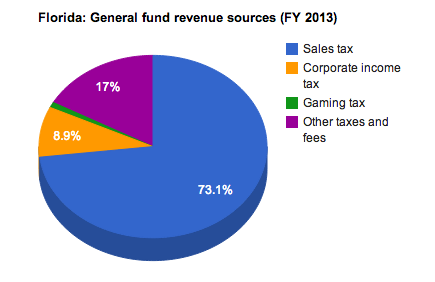
The table below breaks down general fund revenues by source in fiscal year 2013 (comparable figures from surrounding states are also provided to give additional context).[49] Figures for all columns except "Per capita revenue" are rendered in millions of dollars (for example, $2,448 translates to $2,448,000,000). Figures in the column labeled "Per capita revenue" have not been abbreviated.
| Revenue sources in the general fund, FY 2013 ($ in millions)[49] | |||||||
|---|---|---|---|---|---|---|---|
| State | Sales tax | Personal income tax | Corporate income tax | Gaming tax | Other taxes and fees | Total | Per capita revenue |
| Florida | $18,302 | $0 | $2,233 | $242 | $4,244 | $25,021 | $1,279.66 |
| Alabama | $1,945 | $3,104 | $376 | $2 | $1,887 | $7,314 | $1,513.12 |
| Georgia | $5,226 | $8,486 | $706 | $0 | $3,562 | $17,980 | $1,799.41 |
| Mississippi | $1,887 | $1,480 | $463 | $145 | $763 | $4,738 | $1,583.98 |
| South Carolina | $2,448 | $2,796 | $265 | $0 | $742 | $6,251 | $1,309.15 |
| **Per capita figures are calculated by taking the state's total revenues and dividing by the number of state residents according to United States Census estimates for 2013.[50] Source: National Association of State Budget Officers | |||||||
Revenue trends
The table below details the change in revenue sources in the general fund from 2009 to 2013.[49][9] Figures for all columns except "Per capita revenue" are rendered in millions of dollars (for example, $2,448 translates to $2,448,000,000). Figures in the column labeled "Per capita revenue" have not been abbreviated.
| Revenue sources in the general fund, Florida ($ in millions)[49][9] | |||||||
|---|---|---|---|---|---|---|---|
| Year | Sales tax | Personal income tax | Corporate income tax | Gaming tax | Other taxes and fees | Total | Per capita revenue |
| 2013 | $18,302 | $0 | $2,233 | $242 | $4,244 | $25,021 | $1,279.66 |
| 2012 | $17,422 | $0 | $2,011 | $171 | $4,015 | $23,619 | $1,222.47 |
| 2011 | $16,638 | $0 | $1,875 | $171 | $3,868 | $22,552 | $1,181.75 |
| 2010 | $16,015 | $0 | $1,790 | $315 | $3,403 | $21,523 | $1,142.04 |
| 2009 | $16,531 | $0 | $1,833 | $20 | $2,641 | $21,026 | $1,134.21 |
| Change in % | 9.7% | N/A | 17.9% | 91.7% | 37.8% | 16% | 11.4% |
| **Per capita figures are calculated by taking the state's total revenues and dividing by the number of state residents according to United States Census estimates.[50][51] Source: National Association of State Budget Officers | |||||||
Historical spending
The information on state budget historical spending below was compiled by the National Association of State Budget Officers. Figures reflect the reported "Total Expenditures" in Table 1. Figures for all columns are rendered in millions of dollars (for example, $2,448 translates to $2,448,000,000).[49][10]
| Historical state spending in Florida ($ in millions) | |||||||||||||||||
|---|---|---|---|---|---|---|---|---|---|---|---|---|---|---|---|---|---|
| Fiscal year | General Fund | Other funds | Federal funds | Bonds | Budget totals | ||||||||||||
| Total | % of Budget | Total | % of Budget | Total | % of Budget | Total | % of Budget | ||||||||||
| 2011-2012 | $23,053 | 37% | $12,928 | 21% | $24,615 | 39% | $2,393 | 4% | $62,989 | ||||||||
| 2010-2011 | $23,777 | 36% | $9,481 | 14% | $29,403 | 45% | $2,800 | 4% | $65,461 | ||||||||
| 2009-2010 | $21,216 | 34% | $10,612 | 17% | $28,958 | 47% | $1,264 | 2% | $62,050 | ||||||||
| Averages: | $22,682 | 36% | $11,007 | 17% | $27,659 | 44% | $2,152 | 3% | $63,500 | ||||||||
Budget transparency
| Transparency evaluation | ||
|---|---|---|
| Transparency Florida | Florida Has a Right to Know | |
| Searchability | ||
| Grants | ||
| Contracts | ||
| Line item expenditures | ||
| Dept./agency budgets | ||
| Public employee salaries | ||
| Last evaluated in 2013. | ||
Certain public agencies have failed to comply with open records laws.[52]
Florida has had some level of transparency, including "Transparency Florida," an online spending database created by the state's Chief Financial Officer.[53]
Budget review period
Article 3, Section 19(c) of the Florida State Constitution requires that "All general appropriation bills shall be furnished to each member of the legislature, each member of the cabinet, the governor, and the chief justice of the supreme court at least seventy-two hours before final passage by either house of the legislature of the bill in the form that will be presented to the governor."[54]
Government tools
The table to the right is helpful in evaluating the level of transparency provided by Transparency Florida and Florida Has a Right to Know. At the time of the evaluation:
- Transparency Florida was searchable easy to navigate.[55]
- Contracts were available through a search.[56]
- There was a vendor search, but users had to search for specific vendors.[57]
- Department and agency budgets were available.[58]
- Public employee salaries were not available.
Limitations and Suggestions
Florida's Checkbook should post employee salaries just as other state transparency sites (such as the Missouri Accountability Portal) do.
Multi-measure budget transparency profile
The Institute of Government and Public Affairs at the University of Illinois created a multi-measure transparency profile for Florida, which measured state transparency as of September 2011 using indicators from a range of organizations. These indicators measured both website transparency and other recognized facets of governmental transparency. In addition, IGPA presented four unique indicators of non-transparency based on the observation that transfers or reassignments between general and special funds can obscure the true fiscal condition of a state.[59][60]
IGPA devised a budget transparency index based on information available from the National Association of State Budget Officers. Florida tied for eighth in the nation with 12 other states, earning six out of eight possible points.[60]
| Florida - IGPA score for budget process, contents and disclosure | |
|---|---|
| Budget transparency indicator | Yes or no? |
| Performance measures | |
| "Generally Accepted Accounting Principles" budget | |
| Multi-year forecasting | |
| Annual cycle | |
| Binding revenue forecast | |
| Legislative revenue forecast | |
| Nonpartisan staff | |
| Constitution or statutory tax/spend limitations | |
| TOTAL | 6 |
In addition to the individual state profile, IGPA offered a 50-state comparison and profiles for other states.[60]
U.S. PIRG "Following the Money" report
- See also: "Following the Money" report, 2014
The U.S. Public Interest Research Group, a consumer-focused nonprofit organization based in Washington, D.C., released its annual report on state transparency websites in April 2014. The report, entitled "Following the Money," measured the transparency and accountability of state websites with regard to state government spending.[46] According to the report, Florida received a grade of A- and a numerical score of 92.5, indicating that Florida was leading in terms of transparency regarding state spending.[46]
Prior fiscal year budgets
Fiscal year 2016
See budget bill: SB 2500-A
Governor Rick Scott announced his fiscal year 2015 budget proposal on January 28, 2015. Total funding under this proposal totaled about $77 billion, a $93 million decrease from fiscal 2015. General revenue spending would have been $28.3 billion, with education taking about 53.6 percent of that fund. This would have equaled about $19.75 billion in total K-12 spending and included per-pupil spending of about $7,176, the highest in Florida's history. The governor also recommended a zero percent tuition increase in higher education. The budget also proposed $673 million in tax cuts by cutting taxes on cell phones, cable and satellite TV services. Other proposed tax cuts included removing the sales tax on college textbooks and business taxes.[11]
Governor Scott signed the state's fiscal year 2016 budget on June 23, 2015 after several vetoes. The total budget equaled $78.7 billion in spending, $29 billion of which was from general revenue. About $19.7 billion was invested in K-12 education, and $9.3 billion was invested into infrastructure. An additional $4.8 billion was invested in public safety, while also adding funding to the state's Agency of Persons and Disabilities. The budget also included $427 million in tax cuts.[11]
Fiscal year 2015
See budget bill: HB 5003
Governor Rick Scott announced his fiscal year 2015 budget proposal on January 29, 2014. Under the governor's proposal, total state spending for fiscal year 2015 would have equaled approximately $74.2 billion, including $100 million in tax cuts for businesses and a $542 million increase in K-12 education expenditures.[2]
On June 2, 2014, Scott signed into law the fiscal year 2015 budget, which totaled approximately $77 billion. The enacted budget included $500 million in tax cuts and $20.7 billion in K-12 education spending. Scott vetoed roughly $68.9 million in spending.[2]
Fiscal year 2014
See budget bill: SB 1500
| Florida state budget -- 2014 | |
| Florida State Legislature | |
| Text: | SB 1500 |
| Legislative history | |
| Introduced: | April 4, 2013 |
| House: | April 12, 2013 |
| Vote (lower house): | 99-17 |
| Senate: | May 3, 2014 |
| Vote (upper house): | 40-0 |
| Governor: | Rick Scott |
| Signed: | May 20, 2013 |
On Jan. 31, 2013, Governor Rick Scott introduced his proposed FY2014 state budget of $74.2 billion, an increase of $4 billion from the prior year.[61] This was the first time in six years that the governor proposed adding funds to state programs. The budget asked for a pay raise for teachers and state workers, an increase in funding for universities and accepted federal funds to support the Affordable Care Act.[62]
Senate Bill 1500 was unanimously passed by the Florida State Senate on May 3, 2013 after the Florida House of Representatives passed it the same day. The bill increased school funding by $1.2 billion, which included $480 million in salary increases for instructional personnel based on performance.[63] Gov. Scott signed it into law on May 20, 2013 after vetoing specific line items.[64]
Fiscal year 2013
- See also: Florida state budget (2012-2013)
Fiscal year 2012
- See also: Florida state budget (2011-2012)
Fiscal year 2011
- See also: Florida state budget (2010-2011)
Fiscal year 2010
- See also: Florida state budget (2009-2010)
See also
Footnotes
- ↑ Bureau of Labor Statistics, "CPI Detailed Report Data for February 2015," accessed April 4, 2016
- ↑ 2.0 2.1 2.2 2.3 2.4 2.5 2.6 2.7 National Association of State Budget Officers, "Examining fiscal 2013-2015 state spending," accessed April 4, 2016 Cite error: Invalid
<ref>tag; name "nasbo2015" defined multiple times with different content Cite error: Invalid<ref>tag; name "nasbo2015" defined multiple times with different content - ↑ InflationData.com, "Cumulative Inflation Calculator," accessed April 4, 2016. The cumulative rate of inflation during the same period declined -0.1 percent, calculated using the Consumer Price Indices for January 2014 and January 2015.
- ↑ 4.0 4.1 4.2 4.3 National Association of State Budget Officers, "State Expenditure Report: 2013-2015," accessed April 7, 2016
- ↑ 5.0 5.1 5.2 5.3 U.S. Census Bureau, "2014 annual survey of state government tax collections by category," accessed April 4, 2016 Cite error: Invalid
<ref>tag; name "taxcollections" defined multiple times with different content Cite error: Invalid<ref>tag; name "taxcollections" defined multiple times with different content - ↑ United States Census Bureau, "State Government Finances: 2013," accessed March 21, 2016
- ↑ 7.0 7.1 7.2 United States Census Bureau, "State Government Finances: 2012," accessed February 24, 2014
- ↑ United States Census Bureau, "State and County QuickFacts," accessed April 4, 2016
- ↑ 9.0 9.1 9.2 9.3 9.4 National Association of State Budget Officers, "State Expenditure Report, 2009-2011," accessed February 24, 2014
- ↑ 10.0 10.1 10.2 10.3 National Association of State Budget Officers, "State Expenditures Report, 2010-2012," accessed February 24, 2014
- ↑ 11.0 11.1 11.2 11.3 National Association of State Budget Officers, "Summaries of Fiscal Year 2016 Proposed and Enacted Budgets," accessed September 22, 2015
- ↑ State Budget Solutions, "State Budget Solutions' Fourth Annual State Debt Report," January 8, 2014
- ↑ In 2016, State Budget Solutions was absorbed by the American Legislative Exchange Council.
- ↑ Truth in Accounting, "Financial State of the States," September 2015
- ↑ 15.0 15.1 Morningstar, "The State of State Pension Plans 2013: A Deep Dive Into Shortfalls and Surpluses," accessed September 16, 2013
- ↑ The Pew Charitable Trusts, “The Fiscal Health of State Pension Plans: Funding Gap Continues to Grow,” accessed April 16, 2015
- ↑ 17.0 17.1 Stateline: The Daily News Service of The Pew Charitable Trusts, "Infographic: S&P State Credit Ratings, 2001-2012," July 13, 2012
- ↑ Bankrate, "The 6 states with the worst credit ratings," September 27, 2012
- ↑ Stateline: The Daily News Service of The Pew Charitable Trusts, "Infographic: S&P State Credit Ratings, 2001-2014," June 9, 2014
- ↑ Academy Health, "Impact of the Economy on Health Care," August 2009
- ↑ The Conversation, "Budget explainer: What do key economic indicators tell us about the state of the economy?" May 6, 2015
- ↑ Health Affairs, "Socioeconomic Disparities In Health: Pathways And Policies," accessed July 13, 2015
- ↑ The Henry J. Kaiser Family Foundation, "Distribution of Total Population by Federal Poverty Level," accessed July 17, 2015
- ↑ The Henry J. Kaiser Family Foundation, "Median Annual Household Income," accessed July 17, 2015
- ↑ The Henry J. Kaiser Family Foundation, "Unemployment Rate (Seasonally Adjusted)," accessed July 17, 2015
- ↑ The Henry J. Kaiser Family Foundation, "Total Gross State Product (GSP) (millions of current dollars)," accessed July 17, 2015
- ↑ 27.0 27.1 27.2 27.3 27.4 27.5 National Association of State Budget Officers, "Budget Processes in the States, Spring 2021," accessed January 24, 2023
- ↑ National Conference of State Legislatures, "Separation of Powers: Executive Veto Powers," accessed January 26, 2024
- ↑ State Budget Solutions, "Florida: Background," accessed January 14, 2021
- ↑ 30.0 30.1 U.S. Public Interest Research Group, "Following the Money 2015 Report," accessed April 4, 2016
- ↑ Bureau of Labor Statistics, "CPI Detailed Report Data for February 2014," accessed April 9, 2014
- ↑ InflationData.com, "Cumulative Inflation Calculator," February 28, 2014
- ↑ 33.0 33.1 33.2 33.3 33.4 33.5 National Association of State Budget Officers, "State Expenditure Report: 2012-2014," accessed February 18, 2015
- ↑ United States Census Bureau, "State and County QuickFacts," accessed February 23, 2014
- ↑ 35.0 35.1 National Association of State Budget Officers, "State Expenditure Report, 2009," accessed February 24, 2014
- ↑ 36.0 36.1 National Association of State Budget Officers, "State Expenditure Report, 2008," accessed February 24, 2014
- ↑ State Budget Solutions, "State Budget Solutions' Fourth Annual State Debt Report," January 8, 2014
- ↑ In 2016, State Budget Solutions was absorbed by the American Legislative Exchange Council.
- ↑ The Pew Charitable Trusts, “The Fiscal Health of State Pension Plans: Funding Gap Continues to Grow,” accessed April 16, 2015
- ↑ Bankrate, "The 6 states with the worst credit ratings," September 27, 2012
- ↑ Stateline: The Daily News Service of The Pew Charitable Trusts, "Infographic: S&P State Credit Ratings, 2001-2014," June 9, 2014
- ↑ Recovery, "Stimulus Spending by State"
- ↑ Federal Fund Information for States “ARRA FMAP Extension & Education Jobs Fund Totals” Aug. 11, 2010
- ↑ National Conference of State Legislatures, "Separation of Powers: Executive Veto Powers," accessed January 26, 2024
- ↑ State Budget Solutions, "Florida: Background," accessed January 14, 2021
- ↑ 46.0 46.1 46.2 46.3 U.S. Public Interest Research Group, "Following the Money 2014 Report," accessed April 15, 2014
- ↑ Bureau of Labor Statistics, "CPI Detailed Report Data for February 2014," accessed April 9, 2014
- ↑ InflationData.com, "Cumulative Inflation Calculator," February 28, 2014
- ↑ 49.00 49.01 49.02 49.03 49.04 49.05 49.06 49.07 49.08 49.09 49.10 49.11 49.12 49.13 49.14 49.15 National Association of State Budget Officers, "State Expenditure Report, 2011-2013," accessed February 21, 2014
- ↑ 50.0 50.1 50.2 United States Census Bureau, "Annual Estimates of the Resident Population: April 1, 2010 to July 1, 2013," accessed February 26, 2014
- ↑ United States Census Bureau, "Vintage 2009: Annual Population Estimates," accessed February 26, 2014
- ↑ Sun Sentinel, "Many Florida public agencies flunk simple open records test," November 28, 2008
- ↑ "Transparency Florida," accessed August 14, 2013
- ↑ Article 3, Section 19(c), accessed August 14, 2013
- ↑ Florida's Checkbook
- ↑ Contract Search
- ↑ Vendor Payment Search
- ↑ Florida Financials
- ↑ Institute of Government and Public Affairs at University of Illinois, "Home page," accessed February 21, 2014
- ↑ 60.0 60.1 60.2 Institute of Government and Public Affairs at University of Illinois, "Budget Transparency Profiles - All 50 States," September 2011
- ↑ Reuters "Florida governor seeks higher school aid, business tax cuts" Jan. 31, 2013
- ↑ State Scoop, "Analysis: Florida's FY 2014 budget," May 29, 2013
- ↑ Florida Senate, "Press Release: Senate Unanimously Passes 2013-2014 State Budget," May 2, 2013
- ↑ Florida Senate, "SB 1500: Appropriations," accessed April 16, 2014
 |
State of Florida Tallahassee (capital) |
|---|---|
| Elections |
What's on my ballot? | Elections in 2025 | How to vote | How to run for office | Ballot measures |
| Government |
Who represents me? | U.S. President | U.S. Congress | Federal courts | State executives | State legislature | State and local courts | Counties | Cities | School districts | Public policy |