Fayette County Public Schools elections (2016)
2018 →
← 2014 |
|---|
|
|
| Enrollment (13–14): |
|
|
Three of the five seats on the Fayette County Public Schools Board of Education were up for by-district general election on November 8, 2016. District 1 incumbent Melissa Bacon defeated challenger Samantha Rodarte to win re-election to her seat. In District 5, incumbent Daryl Love defeated challenger Sharon Mofield-Boswel. The District 3 incumbent, Raymond Daniels, ran unopposed and won re-election to his seat.[1]
Elections
Voter and candidate information
The Fayette County Board of Education consists of five members elected to four-year terms. Each member is elected to a specific geographic division. There was no primary election, and the general election was held on November 8, 2016.
School board candidates had to file with their county elections department during the candidate filing period, which ended on August 9, 2016. To vote in the 2016 general election, voters had to register by October 11, 2016.[2]
Candidates and results
District 1
Results
| Fayette County Public Schools, District 1 General Election, 4-year term, 2016 |
||
|---|---|---|
| Candidate | Vote % | Votes |
| 57.97% | 10,396 | |
| Samantha Rodarte | 42.03% | 7,538 |
| Total Votes (100) | 17,934 | |
| Source: Fayette County Clerk, "Election Results," accessed December 6, 2016 | ||
Candidates
| Melissa Bacon |
Samantha Rodarte | ||
|---|---|---|---|
|
|
|
|
|

District 3
Results
| Fayette County Public Schools, District 3 General Election, 4-year term, 2016 |
||
|---|---|---|
| Candidate | Vote % | Votes |
| 100.00% | 20,289 | |
| Total Votes (100) | 20,289 | |
| Source: Fayette County Clerk, "Election Results," accessed December 6, 2016 | ||
Candidates
| Raymond Daniels | |
|---|---|
|
|
|
District 5
Results
| Fayette County Public Schools, District 5 General Election, 4-year term, 2016 |
||
|---|---|---|
| Candidate | Vote % | Votes |
| 54.03% | 11,608 | |
| Sharon Mofield-Boswel | 45.97% | 9,877 |
| Total Votes (100) | 21,485 | |
| Source: Fayette County Clerk, "Election Results," accessed December 6, 2016 | ||
Candidates
| Daryl Love |
Sharon Mofield-Boswel | ||
|---|---|---|---|
|
|
|
|
|
Additional elections
- See also: Kentucky elections, 2016
The Fayette County school board election shared the ballot with federal elections for President of the United States, United States Senate, and United States Representative. The statewide elections on the ballot included elections for the Kentucky State Senate, the Kentucky House of Representatives, and a seat on the Kentucky Supreme Court. There were also a municipal election for Fayette County Soil and Water Conservation District Supervisor.[3]
Key deadlines
The following dates were key deadlines for Kentucky school board elections in 2016:[4][5]
| Deadline | Event |
|---|---|
| August 9, 2016 | Candidate filing deadline |
| August 11, 2016 | Public drawing for ballot position |
| October 7, 2016 | First pre-election campaign finance report due |
| October 11, 2016 | Voter registration deadline |
| October 24, 2016 | Second pre-election campaign finance report due |
| November 8, 2016 | Election day |
| December 8, 2016 | Post-election campaign finance report due |
Endorsements
Do you know of an official or organization that endorsed a candidate in this race? Let Ballotpedia know by email at elections@ballotpedia.org.
Campaign finance
Candidates received a total of $2,220.00 and spent a total of $1,064.81 as of October 25, 2016, according to the Kentucky Registry of Election Finance.[6]
Candidates who raised or spent over $3,000 during the election cycle had to file all pre-election and post-election campaign finance reports. Those who raised or spent less than $3,000 were only required to file a 30-day post-election report, while those who raised or spent less than $1,000 did not have to file any reports.[7]
| Candidate | Contributions | Expenditures | Cash on hand |
|---|---|---|---|
| District 1 | |||
| Melissa Bacon | $0.00 | $0.00 | $0.00 |
| Samantha Rodarte | $200.00 | $0.00 | $200.00 |
| District 3 | |||
| Raymond Daniels | $0.00 | $0.00 | $0.00 |
| District 5 | |||
| Daryl Love | $2,000.00 | $1,000.00 | $1,100.00 |
| Sharon Mofield-Boswel | $1,020.00 | $64.81 | $955.19 |
Past elections
Information about earlier elections can be found by clicking [show] at the right. | ||||||||||||||||||||||||||||||||||||||||||||||||||||||||||||||||||||||||||||||||||||||||||||||||||||||||||||||||||||||||||||||||||||||||||||||||||||||||||||||||||||||||||||||||
|---|---|---|---|---|---|---|---|---|---|---|---|---|---|---|---|---|---|---|---|---|---|---|---|---|---|---|---|---|---|---|---|---|---|---|---|---|---|---|---|---|---|---|---|---|---|---|---|---|---|---|---|---|---|---|---|---|---|---|---|---|---|---|---|---|---|---|---|---|---|---|---|---|---|---|---|---|---|---|---|---|---|---|---|---|---|---|---|---|---|---|---|---|---|---|---|---|---|---|---|---|---|---|---|---|---|---|---|---|---|---|---|---|---|---|---|---|---|---|---|---|---|---|---|---|---|---|---|---|---|---|---|---|---|---|---|---|---|---|---|---|---|---|---|---|---|---|---|---|---|---|---|---|---|---|---|---|---|---|---|---|---|---|---|---|---|---|---|---|---|---|---|---|---|---|---|---|
2014
Division 4
2012
2010
| ||||||||||||||||||||||||||||||||||||||||||||||||||||||||||||||||||||||||||||||||||||||||||||||||||||||||||||||||||||||||||||||||||||||||||||||||||||||||||||||||||||||||||||||||
What was at stake?
Report a story for this election
Ballotpedia researches issues in school board elections across the United States, but information availability is a challenge for us in many school districts. Please contact us about the issues that impact your local school district. Note that not all submissions may meet Ballotpedia's coverage requirements for inclusion.
Candidate survey
|
|
Ballotpedia invites school board candidates to participate in its annual survey. |
About the district
- See also: Fayette County Public Schools, Kentucky
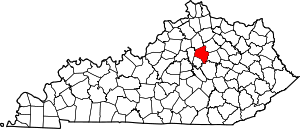
Fayette County Public Schools is located in central Kentucky in Fayette County. The county seat is Lexington. Fayette County was home to 314,488 residents in 2015, according to the United States Census Bureau.[8] The district was the second-largest school district in the state in the 2013–2014 school year and served 40,079 students.[9]
Demographics
Fayette County outperformed Kentucky as a whole in terms of higher education achievement from 2010 to 2014. The United States Census Bureau found that 40.2 percent of county residents aged 25 years and older had attained a bachelor's degree, compared to 21.8 percent of state residents. The median household income for the county was $48,667, compared to $43,342 for the state. The percentage of people below poverty level for the county was 19.8 percent, while it was 18.5 percent for the state.[8]
|
| ||||||||||||||||||||||||||||||||||||||||||||||
Note: Percentages for race and ethnicity may add up to more than 100 percent because respondents may report more than one race and the Hispanic/Latino ethnicity may be selected in conjunction with any race. Read more about race and ethnicity in the census here.
Recent news
The link below is to the most recent stories in a Google news search for the terms 'Fayette County Public Schools' 'Kentucky'. These results are automatically generated from Google. Ballotpedia does not curate or endorse these articles.
See also
| Fayette County Public Schools | Kentucky | School Boards |
|---|---|---|
 |
||
External links
Footnotes
- ↑ Fayette County Clerk, "Candidates Required to File in the County Clerk’s Office," accessed August 15, 2016
- ↑ Kentucky Secretary of State, "2016 Kentucky Election Calendar," accessed September 28, 2016
- ↑ Kentucky Secretary of State, "County Candidate Filings," accessed September 28, 2016
- ↑ Kentucky Registry of Election Finance, "Candidate Reporting Dates," accessed September 28, 2016
- ↑ Kentucky Secretary of State, "2016 Kentucky Election Calendar," accessed September 28, 2016
- ↑ Kentucky Registry of Campaign Finance, "Candidate Search," accessed October 25, 2016
- ↑ Kentucky Registry of Election Finance, "Candidate Guide Campaign Finance," accessed October 25, 2016
- ↑ 8.0 8.1 8.2 United States Census Bureau, "Quickfacts:Fayette County, Kentucky," accessed September 29, 2016
- ↑ National Center for Education Statistics, "ELSI Table Generator," accessed November 16, 2015
- ↑ Kentucky Secretary of State, "Election Results," accessed September 28, 2016