Effect of the Affordable Care Act in Montana (2009-2017)
| Effect of the Affordable Care Act |
|---|
| Overview of the Affordable Care Act |
| The ACA in other states |
| Affordable Care Act glossary |
The data on this page was the most current data available as of October 2017.
|
The impact of the Affordable Care Act of 2010 (ACA), also known as Obamacare, has been debated among politicians, policymakers, and other stakeholders. The ACA was signed into law in 2010 by President Barack Obama (D). The law facilitated the purchase of health insurance through a system of health insurance exchanges, tax credits, and subsidies. Initially, states were required to expand eligibility for Medicaid under the law; a 2012 ruling by the United States Supreme Court made the Medicaid expansion voluntary for states. The law also required insurers to cover healthcare services within a standard set of benefits and prohibited coverage denials based on preexisting conditions. Under the law, all individuals were required to obtain health insurance.
This article presents data that researchers have collected and analyzed, as well as reports they've released based on that data, as they attempt to understand the ACA's impact. See the following sections for more information:
- Health insurance: This section provides information on insurance coverage overall, enrollment in Medicaid, and enrollment through the health insurance exchanges.
- Consumer costs: This section provides information on the average premiums and deductibles paid by consumers.
- Government spending: This section provides information on federal and state spending for Medicaid, tax credits and subsidies, and uncompensated care costs.
- Market reactions: This section provides information on health insurer participation in the exchanges, narrow networks, and direct primary care.
For more information about the Affordable Care Act, click here.
Health insurance
Insurance coverage overall
Following the passage of the ACA in 2010, the nation as a whole saw a decline in the number of individuals without health insurance, particularly following the first open enrollment period for the health insurance exchanges in 2013 and the first state Medicaid expansions in 2014. According to the Census Bureau, between 2013 and 2014, the number of uninsured individuals declined by 18.8%, from 45 million to 36.7 million people. The uninsured rate was 16.3% in 2010, 14.5% in 2013, and 11.7% in 2014. By 2016, about 8.6% of the country lacked health insurance. Between 2013 and 2016, the number of uninsured individuals declined in every state, although the actual rate of decline varied from state to state.[1][2][3]
Between 2013 and 2016, the number of uninsured individuals in Montana declined from 165,000 to 83,000, a 49.7% decrease. As a percentage of the population, the portion of uninsured individuals in Montana fell from 16.5% to 8.1%. The line graph below displays the percentage of Montana's population that lacked health insurance for each year between 2004 and 2016—six years before and after the Affordable Care Act—as compared with the United States as a whole. Hover over the lines to view the data points; the solid line represents Montana, while the dotted line represents the United States. The table below the graph displays figures on the uninsured population for the years 2013 and 2016 in Montana and two of its neighboring states.
| Population without health insurance coverage, 2013 and 2016 | ||||||
|---|---|---|---|---|---|---|
| State | 2013 uninsured | 2016 uninsured | Difference | |||
| Number | Percent | Number | Percent | Number | Percent | |
| Montana | 165,000 | 16.5% | 83,000 | 8.1% | -81,000 | -49.7% |
| Idaho | 257,000 | 16.2% | 168,000 | 10.1% | -89,000 | -34.6% |
| North Dakota | 73,000 | 10.4% | 52,000 | 7.0% | -21,000 | -28.8% |
| United States | 45,181,000 | 14.5% | 27,304,000 | 8.6% | -17,876,000 | -39.6% |
| Source: United States Census Bureau, "Health Insurance Coverage in the United States: 2016" | ||||||
The Affordable Care Act expanded insurance coverage primarily in two ways: by expanding eligibility for state Medicaid programs and by providing tax credits for people to purchase private insurance. The RAND Corporation described the gains in coverage between 2013 and 2015 in the following way:

| “ |
[F]rom October 2013 to April 2015 ... 22.8 million Americans became newly insured and 5.9 million lost coverage, for a net of 16.9 million newly insured Americans. The total number of uninsured Americans dropped from 42.7 million to 25.8 million. Much of this increase was driven by gains in employer-sponsored coverage. Among those newly insured, 9.6 million people enrolled in employer-sponsored health plans, followed by Medicaid (6.5 million), the individual marketplaces (4.1 million), nonmarketplace individual plans (1.2 million) and other insurance sources (1.5 million).[4] |
” |
| —RAND Corporation[5] | ||
The law also provided for the establishment of small business insurance exchanges, called Small Business Health Options Program Marketplaces, or SHOPs. The launch of the federal online website for SHOPs was delayed by one year, from November 2013 to November 2014. As of July 2015, 85,000 Americans were insured through a SHOP. According to data analyst and blogger Charles Gaba, who runs the website ACASignups.net, the federal government did not include SHOP enrollment in its official ACA enrollment reports.[6][7][8][9]
Medicaid expansion
| The Affordable Care Act originally required states to expand eligibility for Medicaid to cover all individuals, including childless adults, whose income was 138% of the federal poverty level (FPL) or below.[10] In 2017, this amounted to $16,643 for individuals and $33,948 for a family of four. In 2012, the U.S. Supreme Court ruled that participation in the expansion must be made voluntary for states.[11][12] |
The provision for expanding Medicaid went into effect nationwide in 2014. As of September 2017, Medicaid expansion had been approved in 31 states. Of these states, six had obtained a waiver from the Centers for Medicare and Medicaid Services (CMS) to expand via an alternative method, such as assisting low-income individuals with paying premiums for private insurance. Nineteen states had not expanded Medicaid at that time.[13]
Montana was one of 31 states that had expanded Medicaid as of September 2017. Even if a state did not expand Medicaid, it could have seen an increase in enrollment in the program due to the ACA's requirement to acquire health insurance. In fiscal year 2015, annual Medicaid enrollment in Montana increased by 8.9%, compared to 8% in 2014 and 4.7% in 2013.[14][15]
In Montana, monthly Medicaid enrollment amounted to 259,000 in May 2017. Before the Affordable Care Act, average monthly enrollment in Montana amounted to 149,000, according to the Kaiser Family Foundation. This represented a difference of 73.8%.[13][16]
| Change in annual Medicaid enrollment, 2013-2015 | |||
|---|---|---|---|
| State | 2013 | 2014 | 2015 |
| Montana | 4.7% | 8.0% | 8.9% |
| Idaho | 3.2% | 5.6% | 9.6% |
| North Dakota | -0.4% | 11.1% | 14.6% |
| Wyoming | 0.0% | -2.0% | 5.9% |
| United States | 2.1% | 9.5% | 14.6% |
| Source: National Association of State Budget Officers, "Fiscal Survey of the States" | |||
Health insurance exchanges
As of September 2017, Montana was one of 28 states with a federally facilitated health insurance exchange. Enrollment in plans offered on the exchange amounted to about 49,000 in 2017. Of individuals enrolled, 85% were eligible for premium tax credits, which averaged $476 per month. In addition, 42% were eligible for reductions in their cost-sharing responsibilities (labeled as CSRs in the graph below), meaning their plans covered more of their costs. The table below provides these figures for Montana and three of its neighboring states.[17][18][19]
| Total exchange enrollment and financial assistance, 2017 | ||||||
|---|---|---|---|---|---|---|
| State | Total exchange enrollment | Number receiving tax credits | Percent of total | Average monthly tax credit received | Number receiving CSRs | Percent of total |
| Montana | 49,007 | 41,765 | 85% | $476 | 20,569 | 42% |
| Idaho | 84,569 | 74,461 | 88% | $354 | 56,165 | 66% |
| North Dakota | 20,306 | 17,244 | 85% | $289 | 9,557 | 47% |
| Wyoming | 22,120 | 20,230 | 91% | $506 | 12,302 | 56% |
| United States | 10,330,759 | 8,707,757 | 84% | $371 | 5,895,662 | 57% |
| Sources: Kaiser Family Foundation, "Total Marketplace Enrollment and Financial Assistance" Kaiser Family Foundation, "Estimated Total Premium Tax Credits Received by Marketplace Enrollees" | ||||||
| Back to top↑ |
Co-ops
The Affordable Care Act also created a new type of nonprofit health insurance company to offer insurance on the exchanges: the Consumer Operated and Oriented Plan, or co-op. The law stipulated that no representative from an insurance company or association can serve on a co-op board and that no co-op can accept outside investor funding. Co-ops were also required to sell most of their plans in the individual or small employer market, while one-third of their plans could be offered in the large employer market. Co-ops received start-up funding through low-interest government loans; some also received solvency loans. Twenty-three co-ops were ultimately established nationwide and collectively received $2.4 billion in loans.[20]
By the end of 2015, 12 of the 23 co-ops had closed. The closed co-ops had collectively received over $1 billion in government loans. According to HealthInsurance.org, an online guide to health insurance, over 1 million people were enrolled in co-ops during 2015 and about 500,000 were impacted by the closures at the end of the year. Individuals who had purchased insurance through these co-ops had to change insurers. Of the remaining co-ops, only one (Maine) was operating with a positive net income in 2015, thus raising the possibility that more co-ops would fail. Over the next year and a half, six more co-ops closed, and as of September 2017, four co-ops remained in operation.[20]
One co-op was established in Montana, the Montana Health Cooperative. As of October 2017, Montana Health Cooperative was still in operation. The co-op covered about 20,000 individuals in 2017, about one-third of total exchange enrollment that year. In December 2016, during the open-enrollment period for 2017, the co-op froze enrollment in its individual health plans, citing a rapid increase in new members. Enrollment resumed in July 2017. The co-op received $85 million in federal start-up and solvency loans, which Montana's State Auditor Matt Rosendale doubted the co-op would be able to pay back. The company expected to draw a $28 million profit in 2017, following losses of $6 million in 2014 and $40 million in 2015.[21][22]
- For more on the co-ops and why they closed, click here.
Consumer costs
Premiums
The studies and analyses below were conducted by various organizations to examine premiums for health insurance plans in the individual market, where most of the ACA's changes took place. Different studies using similar data may find varying results due to variances in the methodologies used by the organizations conducting the studies.
2016 to 2017
The Kaiser Family Foundation (KFF) analyzed the change from 2016 to 2017 in average premiums for benchmark plans offered in major cities in each state, as estimated for a 40-year-old non-smoker earning $30,000 per year. According to KFF, premiums were "expected to increase faster in 2017 than in previous years due to a combination of factors, including substantial losses experienced by many insurers ... and the phasing out of the ACA’s reinsurance program."[23]
In Billings, Montana, the organization found that average premiums for the individuals described above increased by 32%, from $322 per month to $425 per month. The organization also analyzed the change in the premium tax credit provided to such individuals, finding that the average tax credit increased by 92%, from $114 per month to $218 per month. These figures are provided in the table below and compared with those in three of Montana's neighboring states.
| Change in monthly premiums and tax credits for a 40-year-old non-smoker making $30,000/year | |||||||
|---|---|---|---|---|---|---|---|
| State | Major city | Benchmark plan premium | Tax credit | ||||
| 2016 | 2017 | Change | 2016 | 2017 | Change | ||
| Montana | Billings | $322 | $425 | 32% | $114 | $218 | 92% |
| Idaho | Boise | $273 | $348 | 27% | $65 | $141 | 117% |
| North Dakota | Fargo | $304 | $331 | 9% | $96 | $124 | 29% |
| Wyoming | Cheyenne | $426 | $464 | 9% | $218 | $257 | 18% |
| Kaiser Family Foundation, "2017 Premium Changes and Insurer Participation in the Affordable Care Act’s Health Insurance Marketplaces" | |||||||
2015 to 2016
Commonwealth Fund
The Commonwealth Fund examined premiums for all plans offered on the exchanges. The organization found that premiums increased by an average of 6% nationwide from 2015 to 2016. In Montana, the Commonwealth Fund found that premiums increased by an average of 22%. The table below shows average 2016 premiums by plan metal level in Montana and surrounding states, as analyzed by the Commonwealth Fund. N/A indicates that plans in that metal level were not offered in a particular state.[24]
| Average 2016 premiums by metal level | ||||
|---|---|---|---|---|
| State | Bronze | Silver | Gold | Platinum |
| Montana | $279 | $348 | $436 | N/A |
| Idaho | $269 | $325 | $369 | N/A |
| North Dakota | $279 | $346 | $406 | N/A |
| Wyoming | $417 | $486 | $579 | N/A |
| Source: Commonwealth Fund, "Modest Changes in 2016 Health Insurance Marketplace Premiums and Insurer Participation" | ||||
Kaiser Family Foundation
For premium changes from 2015 to 2016, an analysis of benchmark plans from the Kaiser Family Foundation found an average increase of 10.1% on the exchanges. For Montana, the organization found that benchmark premiums on the state exchange increased by an average of 33.6% in the Billings market, from $241 to $322.[25]
PricewaterhouseCoopers
An analysis from PricewaterhouseCoopers of premium changes from 2015 to 2016 found that average premiums for benchmark plans offered on the exchanges rose by 4.2%. In Montana, the organization found that average benchmark premiums rose by 33% from 2015 to 2016.[26]
- To read more about premium changes in prior years, click 'Show more' below.
2014 to 2015
- Commonwealth Fund
- The Commonwealth Fund performed a study on premium costs for all plans on the exchanges and found no change nationwide between 2014 premiums and 2015 premiums. For Montana, the Commonwealth Fund found average premium increases of 3% from 2014 to 2015.[27]
- Heritage Foundation
- The Heritage Foundation performed an analysis of the change in premiums from 2014 to 2015 for plans offered on the exchanges and found a nationwide increase of 5.3%. In Montana, the organization found an average increase of 2% for individuals age 27, from $214 to $218 per month. For individuals age 50, the organization found an increase of 1%, from $364 to $368.[28]
- Kaiser Family Foundation
- The Kaiser Family Foundation analyzed the change in premiums for benchmark plans—used to calculate subsidy amounts—from 2014 to 2015 and found a nationwide 2% increase in premiums. In the market for Billings, Montana, KFF found an average decrease of 6.6% in benchmark plan premiums, from $258 to $241 per month.[29]
- PricewaterhouseCoopers
- PricewaterhouseCoopers also analyzed premiums for benchmark plans offered on the exchanges and found a nationwide decrease of 0.2% from 2014 to 2015. In Montana, the organization found that average premiums for benchmark plans decreased by 7%.[26]
| Back to top↑ |
2013 to 2014
In fall of 2014, a working paper from the National Bureau of Economic Research (NBER), published by the Brookings Institution, found that 2014 premiums in the entire non-group (individual) market (on and off the exchanges) had increased by 24.4% more than they would have risen without the Affordable Care Act. Additionally, the increase in insurers' costs was 11% greater than without the ACA. The results indicated that premium markups increased in 41 states. The paper posited that because insurers had to set premiums before open enrollment, they may have set them high to safeguard the possibility of a sicker-than-expected, and thus costlier, pool of new consumers.[30]
In the table below, the label Pre-ACA refers to what premiums and costs would have been without the passage of the ACA. The label Post-ACA refers to the actual average premiums and costs in the individual market during the first half of 2014. In Montana, the paper's author found a 83.6% increase in premiums and a 31.7% increase in insurers' costs relative to what they would have been without the ACA.[30]
| Individual market monthly premiums with and without the ACA, by NBER | |||||||
|---|---|---|---|---|---|---|---|
| State | Average monthly premium | Average monthly cost for insurers | Markup increase? | ||||
| Pre-ACA | Post-ACA | Change | Pre-ACA | Post-ACA | Change | ||
| Montana | $226 | $415 | 83.6% | $224 | $295 | 31.7% | Yes |
| North Dakota | $284 | $310 | 9.2% | $272 | $269 | -1.1% | Yes |
| South Dakota | $249 | $274 | 10.0% | $215 | $250 | 16.3% | No |
| Wyoming | $329 | $389 | 18.2% | $239 | $286 | 19.7% | Yes |
| Source: Kowalski, Amanda E., National Bureau of Economic Research, "The Early Impact of the Affordable Care Act, State by State" | |||||||
Analysis

According to the American Academy of Actuaries, the major drivers of premium changes from 2017 to 2018 were the underlying growth in healthcare costs and regulatory uncertainty. The organization issued a report stating that costs for healthcare services and prescription drugs were expected to rise between 5 and 8% in 2018. In addition, the report listed four areas of regulatory uncertainty impacting health insurance premiums in 2018:[31]
- uncertainty related to whether cost-sharing reduction reimbursements would continue to be paid;
- uncertainty related to enforcement of the individual mandate;
- uncertainty related to how the shorter open enrollment period (November 1, 2017, to December 15, 2017) and stricter rules for special enrollment periods would impact the risk pool; and
- uncertainty related to potential legislative changes to the ACA.
Other drivers of premium changes included state programs to reimburse insurers for high-cost enrollees that could put downward pressure on premiums, changes in the composition of the risk pool, and the reinstatement of the ACA's fee on health insurers.[31]
According to the American Academy of Actuaries, the major drivers of premium changes from 2016 to 2017 were the underlying growth in healthcare costs, the end of the reinsurance program, and the availability of more complete information on the health status of the risk pool. Although increases in the cost of healthcare services were expected to be lower than in previous years, insurers were uncertain about whether this trend would continue. In addition, the end of the federal reinsurance program, which had reimbursed insurers for high-cost enrollees, put upward pressure on premiums.[32]
Other drivers of premium changes included a suspension of the ACA's fee on health insurers, putting downward pressure on premiums, a change in the legal definition of small employer, and narrower provider networks.[32]
According to an article by PolitiFact, premium increases in the individual market were expected by healthcare policy analysts. The article suggested that increases could be due to the following reasons:[33]
- A requirement for plans offered on the exchanges to cover a standard set of benefits that weren't covered before;
- Two provisions known as guaranteed issue and community rating that prevented denial of coverage to individuals with pre-existing conditions and also prohibited differing premium rates based on those conditions and other observable characteristics, such as gender. These two provisions were expected to result in rate increases for everyone to cover associated costs; and
- Higher-than-expected medical loss ratios, meaning insurers paid more for claims than expected, or in some cases paid more in claims than they received in premium revenue.[34]
According to the Robert Wood Johnson Foundation, prior to 2014's implementation of the requirement to cover a standard set of benefits, less than half of people with individual coverage were in plans that covered those benefits. The organization found that new benefits likely resulted in an increase in the number of claims filed with insurers and thus an increase in costs requiring an increase in premiums.[34]
Premiums for employer-sponsored insurance
The Henry J. Kaiser Family Foundation found from 2013 to 2014 increases for employer-sponsored insurance (both small and large group) were smaller than those in the individual market: average single coverage premiums increased nationwide by 2%. KFF stated that this "difference [was] not statistically significant," meaning premiums were essentially unchanged. Meanwhile, average family coverage premiums increased by 3%. From 2014 to 2015, the organization found an increase of 4% for both single and family coverage, "continuing a fairly long period (2005 to 2015) where annual premium growth has averaged about 5%."[35][36]
According to subsequent KFF reports, employer-based coverage premiums increased by 2.9% for single plans and 3.4% for family plans from 2015 to 2016, and by 4% for single plans and 3% for family plans from 2016 to 2017. State-based data was not available in any of the reports.[37][38]
Deductibles
2016
According to the Kaiser Family Foundation, in 2016, average deductibles in the 37 states with federally facilitated or partnership exchanges were as follows:[39]
- $5,765 for combined medical and prescription drug deductibles on bronze plans (89% of bronze plans had combined deductibles);
- $3,064 for combined deductibles on silver plans (56% of silver plans had combined deductibles);
- $3,198 for separate medical deductibles on silver plans (44% of silver plans had separate medical and prescription drug deductibles);
- $1,136 for separate medical deductibles on gold plans (57% of gold plans had separate deductibles); and
- $409 for separate medical deductibles on platinum plans (73% of platinum plans had separate deductibles).
2015
In 2014, the publication Modern Healthcare estimated that 60 to 80% of health plans on the exchanges would be high deductible health plans in 2015. For 2015, the Internal Revenue Service considered plans with deductibles of at least $1,300 for single coverage and $2,600 for family coverage to be high-deductible plans. According to the Kaiser Family Foundation, in 2015, average deductibles in the 37 states with federally facilitated or partnership exchanges were as follows:[40][41][42]
- $5,328 for combined medical and prescription drug deductibles on bronze plans (91% of bronze plans had combined deductibles);
- $2,556 for combined deductibles on silver plans (55% of silver plans had combined deductibles);
- $3,453 for separate medical deductibles on silver plans (45% of silver plans had separate medical and prescription drug deductibles);
- $1,431 for separate medical deductibles on gold plans (63% of gold plans had separate deductibles); and
- $418 for separate medical deductibles on platinum plans (62% of platinum plans had separate deductibles).
| Back to top↑ |
Government spending
Overall
In 2016, the Congressional Budget Office (CBO) estimated the net cost to the federal government of the subsidies, taxes, and penalties associated with the health insurance coverage provisions of the ACA to be $8.9 trillion between 2017 and 2026. This was $1.4 trillion higher than if the ACA had never been enacted. This was the most recent report from the CBO on the ACA's impact on federal spending as of October 2017; the report stated that the CBO would no longer estimate the specific impact of the ACA on the federal budget because "generating such estimates is becoming more difficult and less meaningful" as time goes on.[43]
For states, the primary changes in spending associated with the ACA were on Medicaid and uncompensated care. States that ran their own exchanges were also responsible for financing them, which The Washington Post reported in 2015 could cost these states $28 million to $32 million per year.[44][45]
Medicaid
- See also Medicaid spending in Montana
Spending on Medicaid expansion
| The Affordable Care Act provided for states to expand eligibility for their Medicaid programs to cover childless adults whose income amounted to 138% of the federal poverty level (FPL) or below. The federal government paid 100% of the costs for these enrollees for the first few years of the expansion. The law incrementally reduced the federal share of the cost of these individuals to reach 90% in 2020 and remain there thereafter. |
On January 1, 2017, states began contributing 5% of the total cost of covering expansion enrollees; this amount increased to 6% in 2018. Some states that covered childless adults through Medicaid before the Affordable Care Act were already contributing some state funds to their coverage before January 1, 2017. For individuals who had been eligible for Medicaid prior to the expansion but chose to enroll afterward, the federal share of their costs remained at pre-ACA levels.[46]
In its spring 2017 report, the National Association of State Budget Officers collected data from states on spending for individuals enrolled in Medicaid under the expanded eligibility provisions of the ACA. Montana reported that about $107 million was spent on its residents during 2016, with 99.1% of this spending being funded by the federal government. The table below provides these figures as broken down into state funds and federal funds for Montana and three neighboring states. Information was collected only from states that had expanded Medicaid; N/A indicates a neighboring state that did not expand Medicaid.[46]
| Medicaid expansion spending by state, 2016 | ||||||
|---|---|---|---|---|---|---|
| State | Dollars | Percent | ||||
| State | Federal | Total | State | Federal | ||
| Montana | $1,000,000 | $106,000,000 | $107,000,000 | 0.9% | 99.1% | |
| Idaho | N/A | N/A | N/A | N/A | N/A | |
| North Dakota | $7,000,000 | $302,000,000 | $309,000,000 | 2.3% | 97.7% | |
| Wyoming | N/A | N/A | N/A | N/A | N/A | |
| United States | $4,522,000,000 | $74,144,000,000 | $78,000,000,000 | 5.8% | 95.1% | |
| Source: National Association of State Budget Officers, "The Fiscal Survey of the States: Spring 2017" | ||||||
Projected Medicaid spending
Between 2012 and 2016, the Congressional Budget Office released a series of reports that estimated the impact of the Affordable Care Act on state Medicaid spending over the following 10 years:[44][47][48][49][50][51]
- March 2012: The CBO estimated that between 2012 and 2022, total state spending for Medicaid would be $73 billion higher than it would have been without the ACA.
- The Center on Budget and Policy Priorities calculated this to represent a 2.8% difference.
- July 2012: The CBO revised its estimates due to the Supreme Court ruling that Medicaid expansion must be made voluntary on the part of the states. That estimate put the impact of the ACA on state Medicaid spending at $41 billion.
- February 2014: The CBO estimated Medicaid spending would be $70 billion higher between 2015 and 2024 than without the ACA.
- April 2014: The CBO reduced its estimate for the impact of the ACA on state Medicaid spending to $46 billion, where it remained in its March 2015 estimate for 2016 through 2025.
In the CBO's March 2016 estimate of the impact of the ACA on the federal budget, the agency stated it would no longer estimate the impact of the ACA on government spending as compared to no ACA because "generating such estimates is becoming more difficult and less meaningful" over time. The March 2016 report did not estimate the effects on state spending.[43]
Total Medicaid spending, 2012-2016
During fiscal year 2016, combined federal and state spending for Medicaid in Montana totaled about $1.4 billion. Spending on Montana's Medicaid program increased by about 42.1% between fiscal years 2012 and 2016.[52][53][54][55][56]
| Total Medicaid spending, fiscal years 2012 - 2016 | ||||||
|---|---|---|---|---|---|---|
| State | 2012 | 2013 | 2014 | 2015 | 2016 | Percentage change |
| Montana | $972,565,512 | $1,007,145,361 | $1,085,468,758 | $1,132,392,709 | $1,381,900,546 | 42.1% |
| Idaho | $1,451,713,522 | $1,672,080,653 | $1,608,317,929 | $1,715,448,736 | $1,710,240,712 | 17.8% |
| North Dakota | $744,160,777 | $784,117,048 | $654,709,673 | $533,643,617 | N/A | -28.3% |
| Wyoming | $528,478,993 | $554,122,142 | $547,711,059 | $558,961,575 | $580,911,047 | 9.9% |
| United States | $415,154,234,831 | $438,233,172,298 | $475,910,000,000 | $523,709,237,879 | $553,453,647,756 | 33.31% |
| Note: Expenditures include both state and federal expenditures. Expenditures do not include administrative costs. Percentages calculated by Ballotpedia. | ||||||
Tax credits
The Kaiser Family Foundation estimated the total amount of premium tax credits received during 2017 by residents in each state. The organization calculated this estimate by multiplying the total number of enrollees by the average tax credit received. Federal spending on cost-sharing reductions was not calculated. In Montana, residents received an estimated combined total of $238.8 million in federal tax credits during 2017. The table below shows the amounts calculated by the Kaiser Family Foundation for Montana and three neighboring states.[57]
| Estimated total premium tax credits by state, 2017 | ||||||
|---|---|---|---|---|---|---|
| State | Total tax credits | |||||
| Montana | $238,752,000 | |||||
| Idaho | $316,203,000 | |||||
| North Dakota | $59,740,000 | |||||
| Wyoming | $122,892,000 | |||||
| United States | $38,815,001,000 | |||||
| Source: Kaiser Family Foundation, "Estimated Total Premium Tax Credits Received by Marketplace Enrollees" | ||||||
Uncompensated care
Uncompensated care is the sum of healthcare services provided to patients without reimbursement; this includes both charity care and bad debt. In 2013, total government spending for uncompensated care nationwide amounted to $53.3 billion. The federal government paid $32.8 billion, while state and local governments paid $19.8 billion. Due to the expansion of insurance coverage options (Medicaid in some states and health insurance exchanges in every state), states could see a reduction in their spending for uncompensated healthcare. According to a 2015 report from the U.S. Department of Health and Human Services, in 2014, uncompensated care costs declined by $5 billion in states that expanded Medicaid and by $2.4 billion in states that did not. State-level data was not available.[58][59]
According to a separate report from the American Hospital Association, uncompensated care costs nationwide amounted to $35.7 billion in 2015. This was a decline of $7.1 billion from 2014, when the organization estimated uncompensated care costs amounted to $42.8 billion.[60]
| Back to top↑ |
Market reactions
Number of insurers on exchange
In July 2017, the Centers for Medicare and Medicaid Services issued a press release stating that fewer health insurers had applied to offer plans on the health insurance exchanges for 2018, 141 compared to 227 applying to offer plans for 2017. The press release followed announcements from Humana and Aetna that they would not offer any health plans on any state exchange in 2018. In addition, in 2016, UnitedHealthcare had announced that it would exit all but three exchanges in 2017. The insurers said their decisions to exit the markets were based on financial losses and regulatory uncertainty regarding the cost-sharing reduction reimbursements.[61][62][63][64][65]
Nationwide, an average of 4.3 insurers per state offered plans on the exchanges, compared to five insurers in 2014 and six in 2015. In Montana, three insurers offered plans on the state's health insurance exchange in 2017, the same number as in 2016. The table below displays the number of health insurers that offered plans on each state's exchange for each year between 2014 and 2017. This information is provided for Montana and three of its neighboring states.[66]
| Number of health insurers offering plans on the ACA exchanges | ||||
|---|---|---|---|---|
| State | 2014 | 2015 | 2016 | 2017 |
| Montana | 3 | 4 | 3 | 3 |
| Idaho | 4 | 5 | 5 | 5 |
| North Dakota | 3 | 3 | 3 | 3 |
| Wyoming | 2 | 2 | 1 | 1 |
| United States | 5 | 6 | 5.6 | 4.3 |
| Source: Kaiser Family Foundation, "Number of Issuers Participating in the Individual Health Insurance Marketplaces" | ||||
Narrow networks
The Affordable Care Act required insurers to design plans that offered a standard set of health benefits, termed by the law as essential health benefits. The law also prohibited them from denying coverage to individuals with pre-existing conditions or from varying a person's premium for any reason other than age, tobacco use, and location. These provisions limited the ways insurers could design plans that featured lower premiums. One way insurers kept premiums down was to offer plans with limited or narrow networks, meaning they contracted with fewer providers for services in exchange for lower prices. The Robert Wood Johnson Foundation found that in 2014, 41% of silver-level plans, the most common type sold on the state exchanges, offered narrow networks. In a separate study, management consulting firm McKinsey & Company found that in 2014, 39% of plans offered on the exchanges had narrow hospital networks; in 2015, they found that this figure had increased to 45%.[31][67][68]
Although they could allow insurers to offer lower premiums, narrow networks restricted consumers' choice of providers by design. According to Kaiser Health News, this sometimes caused consumers to drive long distances for care, impeded their access to providers, or resulted in high out-of-pocket costs for necessary care because the provider was out of network. Some state regulators have enacted legislation requiring insurers to offer wider provider networks, sometimes referred to as network adequacy standards. Just over half of states applied network adequacy standards to plans offered on their exchanges. As of November 2015, Montana was one of these states, limiting (1) the distance patients must travel for care, (2) the number of enrollees per provider (for example, requiring plans to include one provider for every 2,500 enrollees), and (3) the length of time patients must wait for an appointment. These standards only apply to specific types of network plans, and do not necessarily apply to all marketplace plans in the state.[69][70][71]
Direct primary care
- See also: Direct primary care

Direct primary care, a type of retainer-based healthcare, is a healthcare model that emerged as an alternative to the system of paying for healthcare with health insurance. In a direct primary care arrangement, patients contract directly with their primary care physicians, paying a flat monthly, quarterly, or annual fee—also called a retainer—that covers all primary care visits and services over the time period. According to the Heritage Foundation, doctors switch to direct primary care practices due to concerns about "doctor shortages, narrow networks, and ... third-party reimbursement." In 2004, the U.S. Government Accountability Office identified 146 retainer-based practices, which included direct primary care as well as other types of retainer-based healthcare, such as concierge medicine. In 2010, the National Opinion Research Center found that this number had increased to 756. In 2012, the American Academy of Private Physicians counted 4,400 direct primary care practices.[72][73][74][75]
In direct primary care, the physician's practice does not accept insurance; instead, a monthly fee of typically $100 or less is charged and covers all services. Alongside the arrangement with their primary care physician, individuals often have a supplementary insurance plan that covers specialist and catastrophic care. Direct primary care practices often see fewer patients than traditional practices, and their physicians tend to spend more time with their patients in appointments.[75][76][77]
The Affordable Care Act contained a provision allowing direct primary care plans to be sold on the health exchanges along with a wraparound insurance plan. Under the law, direct primary care on its own did not constitute insurance. However, in 2005, the West Virginia Insurance Commission investigated a concierge medicine practice for potentially violating state insurance laws. As of November 2015, 15 states had either introduced or enacted legislation clarifying that direct primary care is not subject to insurance laws and removing them from liability. As of November 2015, Montana was not one of these states.[73][78][79][80]
| Back to top↑ |
Historical data
Medical loss ratio rebates
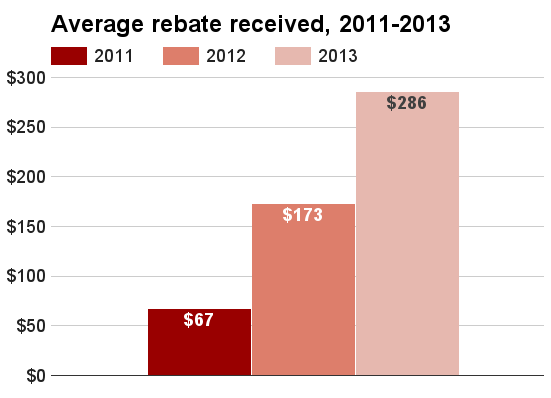
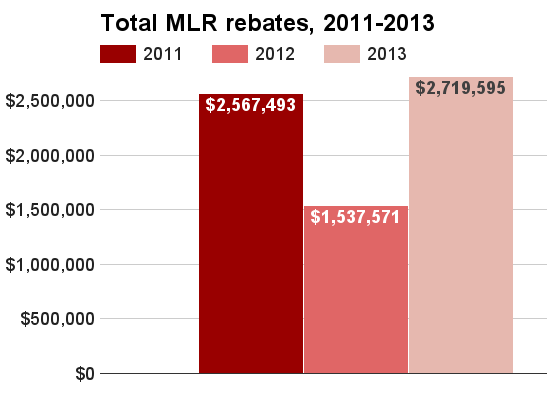
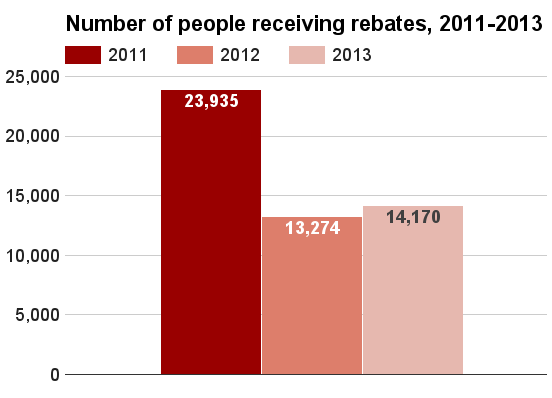
For the 2011 plan year, health insurers rebated about $2.6 million to nearly 24,000 consumers in Montana. For the 2012 plan year, these figures fell: about $1.4 million was rebated to about 13,000 consumers, who received about $173 each on average. The number of consumers receiving rebates for 2013 increased to over 14,000, while the total amount rebated rose higher than the 2011 figure at about $2.7 million. The three charts below provide data on total medical loss ratio (MLR) rebates, the number of consumers affected, and the average rebate per person in Montana for 2011 through 2013. The 2011 data on consumers receiving rebates and average rebate per consumer come from a preliminary estimate by the Henry J. Kaiser Family Foundation because state data on actual figures were not available. All other data come from the Centers for Medicare and Medicaid Services. As of December 2015, data for 2014 was not yet available. Click on a chart to view a larger image.[81][82][83][84]
Insurance coverage overall
In Montana, between 2013 and 2014, the number of uninsured individuals declined by 13.3%, from 165,000 individuals to 143,000 individuals. As a percentage of the population, the figure declined from 16.5% of the population to 14.2% of the population.[85][86]
| Population without health insurance coverage, 2013 and 2014 | ||||||
|---|---|---|---|---|---|---|
| State | 2013 uninsured | 2014 uninsured | Difference | |||
| Number | Percent | Number | Percent | Number | Percent | |
| Montana | 165,000 | 16.5% | 143,000 | 14.2% | -21,000 | -13.3% |
| North Dakota | 73,000 | 10.4% | 57,000 | 7.9% | -16,000 | -21.9% |
| South Dakota | 93,000 | 11.3% | 82,000 | 9.8% | -11,000 | -11.8% |
| Wyoming | 77,000 | 13.4% | 69,000 | 12.0% | -8,000 | -10.4% |
| United States | 45,181,000 | 14.5% | 36,670,000 | 11.7% | -8,510,000 | -18.8% |
| Source: United States Census Bureau, "Health Insurance Coverage in the United States: 2014" | ||||||
Health insurance exchange enrollment
To view historical data on health insurance exchange enrollment in Montana, click Show more below to expand the section.
Enrollment in plans offered on Montana's health insurance exchange in 2015 amounted to 48,600, which was 40% of the estimated number of individuals who were most likely to enroll, namely uninsured residents ineligible for Medicaid and those who typically purchased individual insurance. Of individuals enrolled, 82.8% were eligible for advanced premium tax credits, which averaged $230 per month. In addition, 50.9% were eligible for reductions in their cost-sharing responsibilities, meaning their plan covered more of their costs.[87][88][89]
| Total marketplace enrollment and financial assistance, 2015 | ||||||||
|---|---|---|---|---|---|---|---|---|
| State | Total marketplace enrollment | Estimated number of potential 2015 enrollees | Percent of potential population enrolled | Number receiving tax credits | Percent of total | Average monthly tax credit | Number receiving cost-sharing reductions | Percent of total |
| Montana | 48,591 | 121,000 | 40% | 40,231 | 82.8% | $230 | 24,731 | 50.9% |
| North Dakota | 16,651 | 78,000 | 21% | 14,244 | 85.5% | $231 | 7,021 | 42.2% |
| South Dakota | 18,983 | 101,000 | 19% | 16,618 | 87.5% | $224 | 12,138 | 63.9% |
| Wyoming | 18,065 | 65,000 | 28% | 16,653 | 92.2% | $424 | 9,343 | 51.7% |
| United States | 9,949,079 | 28,066,000 | 35% | 8,329,966 | 83.7% | $270 | 5,572,833 | 56% |
| Sources: National Conference of State Legislatures, "State Actions to Address Health Insurance Exchanges" The Henry J. Kaiser Family Foundation, "Marketplace Enrollment as a Share of the Potential Marketplace Population" The Henry J. Kaiser Family Foundation, "Average Monthly Advance Premium Tax Credit (APTC)" | ||||||||
Recent news
The link below is to the most recent stories in a Google news search for the terms Affordable Care Act Montana. These results are automatically generated from Google. Ballotpedia does not curate or endorse these articles.
See also


Effect of the Affordable Care Act in the 50 states
Click on a state below to read more about how the Affordable Care Act has affected that state.
Footnotes
- ↑ United States Census Bureau, "Health Insurance Coverage in the United States: 2014," September 16, 2015
- ↑ United States Census Bureau, "Health Insurance Coverage in the United States: 2016," accessed September 22, 2017
- ↑ United States Census Bureau, "Health Insurance Coverage Status and Type of Coverage by State--All Persons: 1999 to 2012," accessed November 4, 2015
- ↑ Note: This text is quoted verbatim from the original source. Any inconsistencies are attributable to the original source.
- ↑ RAND, "The Affordable Care Act in Depth," accessed October 10, 2015
- ↑ Kaiser Health News, "Small Business Health Insurance Exchanges Are Off To A Rocky Start," July 10, 2015
- ↑ The Washington Post, "Obamacare’s online SHOP enrollment delayed by one year," November 27, 2013
- ↑ Centers for Medicare and Medicaid Services Blog, "Update on SHOP Marketplaces for Small Businesses," July 2, 2015
- ↑ ACASignups.net, "UPDATE: There's a reason you never see SHOP data reported in ASPE or CMS reports," May 10, 2016
- ↑ Although the law raised maximum Medicaid eligibility to 133% of the FPL, it stipulated a way of calculating income that resulted in an effective income limit of 138% FPL. This new method of income calculation was called Modified Adjusted Gross Income (MAGI). MAGI was also used to determine eligibility for tax credits. More about MAGI can be found here.
- ↑ The Henry J. Kaiser Family Foundation, "Medicaid Financing: How Does it Work and What are the Implications?" May 20, 2015
- ↑ Healthcare.gov, "Medicaid expansion & what it means for you," accessed October 20, 2015
- ↑ 13.0 13.1 National Academy for State Health Policy, "Where States Stand on Medicaid Expansion Decisions," accessed August 30, 2017
- ↑ National Association of State Budget Officers, "The Fiscal Survey of the States: Spring 2015," accessed September 22, 2017
- ↑ National Association of State Budget Officers, "The Fiscal Survey of the States: Spring 2016," accessed September 22, 2017
- ↑ Cite error: Invalid
<ref>tag; no text was provided for refs namedKFFmonthlyMedicaid - ↑ National Conference of State Legislatures, "State Actions to Address Health Insurance Exchanges," accessed November 8, 2017
- ↑ Henry J. Kaiser Family Foundation, "Total Marketplace Enrollment and Financial Assistance," accessed November 8, 2017
- ↑ Henry J. Kaiser Family Foundation, "Estimated Total Premium Tax Credits Received by Marketplace Enrollees," accessed November 8, 2017
- ↑ 20.0 20.1 HealthInsurance.org, "CO-OP health plans: patients’ interests first," August 27, 2017
- ↑ The Seattle Times, "Montana’s Health Co-op remains standing as others falter," August 12, 2017
- ↑ HealthInsurance.org, "Montana health insurance marketplace: history and news of the state’s exchange," October 17, 2017
- ↑ Kaiser Family Foundation, "2017 Premium Changes and Insurer Participation in the Affordable Care Act’s Health Insurance Marketplaces," November 1, 2016
- ↑ Commonwealth Fund, "Modest Changes in 2016 Health Insurance Marketplace Premiums and Insurer Participation," January 28, 2016
- ↑ The Henry J. Kaiser Family Foundation, "Analysis of 2016 Premium Changes in the Affordable Care Act’s Health Insurance Marketplaces," October 1, 2015
- ↑ The Commonwealth Fund, "Analysis Finds No Nationwide Increase in Health Insurance Marketplace Premiums," December 22, 2014
- ↑ Heritage Foundation, "2015 ACA-Exchange-Premiums Update: Premiums Still Rising," March 20, 2015
- ↑ The Henry J. Kaiser Family Foundation, "Analysis of 2015 Premium Changes in the Affordable Care Act’s Health Insurance Marketplaces," January 6, 2015
- ↑ 30.0 30.1 Kowalski, Amanda E., Brookings Institution, "The Early Impact of the Affordable Care Act, State by State," accessed October 23, 2015
- ↑ 31.0 31.1 31.2 American Academy of Actuaries, "Drivers of 2018 Health Insurance Premium Changes," accessed October 9, 2017
- ↑ 32.0 32.1 American Academy of Actuaries, "Drivers of 2017 Health Insurance Premium Changes," accessed October 9, 2017
- ↑ PolitiFact Florida, "Health insurance costs are skyrocketing under Obamacare, Republican Party says," September 29, 2014
- ↑ 34.0 34.1 Robert Wood Johnson Foundation, "Where Might Premiums Be Heading?" October 2015
- ↑ The Henry J. Kaiser Family Foundation, "2014 Employer Health Benefits Survey," September 10, 2014
- ↑ The Henry J. Kaiser Family Foundation, "2015 Employer Health Benefits Survey," September 22, 2015
- ↑ Kaiser Family Foundation, "2016 Employer Health Benefits Survey," September 14, 2016
- ↑ Kaiser Family Foundation, "2017 Employer Health Benefits Survey," September 19, 2017
- ↑ Kaiser Family Foundation, "Patient Cost-Sharing in Marketplace Plans, 2016," November 13, 2015
- ↑ Modern Healthcare, "High-deductible plans dominate next open enrollment," November 13, 2014
- ↑ Internal Revenue Service, "26 CFR 601.602: Tax forms and instructions," accessed October 24, 2015
- ↑ The Henry J. Kaiser Family Foundation, "The Cost of Care with Marketplace Coverage," accessed October 25, 2015
- ↑ 43.0 43.1 Congressional Budget Office, "Federal Subsidies for Health Insurance Coverage for People Under Age 65: 2016 to 2026," March 24, 2016
- ↑ 44.0 44.1 Center on Budget and Policy Priorities, "How Health Reform’s Medicaid Expansion Will Impact State Budgets," July 25, 2012
- ↑ The Washington Post, "Almost half of Obamacare exchanges face financial struggles in the future," May 1, 2015
- ↑ 46.0 46.1 National Association of State Budget Officers, "The Fiscal Survey of the States: Spring 2017," accessed October 3, 2017
- ↑ Congressional Budget Office, "Updated Estimates for the Insurance Coverage Provisions of the Affordable Care Act," March 2012
- ↑ Congressional Budget Office, "Estimates for the Insurance Coverage Provisions of the Affordable Care Act Updated for the Recent Supreme Court Decision," July 2012
- ↑ Congressional Budget Office, "Insurance Coverage Provisions of the Affordable Care Act—CBO's February 2014 Baseline," February 2014
- ↑ Congressional Budget Office, "Insurance Coverage Provisions of the Affordable Care Act—CBO’s April 2014 Baseline," April 14, 2014
- ↑ Congressional Budget Office, "Insurance Coverage Provisions of the Affordable Care Act—CBO’s March 2015 Baseline," March 9, 2015
- ↑ The Henry J. Kaiser Family Foundation, "Total Medicaid Spending - 2012," accessed July 17, 2015
- ↑ Kaiser Family Foundation, "Total Medicaid Spending - 2013," accessed May 31, 2017
- ↑ Kaiser Family Foundation, "Total Medicaid Spending - 2014," accessed May 31, 2017
- ↑ MACPAC, "Medicaid Spending by State, Category, and Source of Funds," accessed May 31, 2017
- ↑ Kaiser Family Foundation, "Total Medicaid Spending - 2016," accessed May 31, 2017
- ↑ Kaiser Family Foundation, "Estimated Total Premium Tax Credits Received by Marketplace Enrollees," accessed October 3, 2017
- ↑ The Henry J. Kaiser Family Foundation, "Uncompensated Care for the Uninsured in 2013: A Detailed Examination," May 30, 2014
- ↑ Office of The Assistant Secretary for Planning and Evaluation, "Economic Impact of the Medicaid Expansion," May 23, 2015
- ↑ Healthcare Finance, "Uncompensated care costs at lowest level in 26 years at roughly $36 billion," January 9, 2017
- ↑ Centers for Medicare and Medicaid Services, "Fewer issuers apply to participate in Health Insurance Exchanges for 2018," July 10, 2017
- ↑ Fortune, "UnitedHealth Is Ditching Obamacare's California Market," June 1, 2016
- ↑ Kaiser Health News, "UnitedHealthcare To Exit All But ‘Handful’ Of Obamacare Markets In 2017," April 19, 2016
- ↑ The Washington Post, "Aetna exiting all ACA insurance marketplaces in 2018," May 10, 2017
- ↑ Modern Healthcare, "Humana will exit ACA exchanges in 2018," February 14, 2017
- ↑ Kaiser Family Foundation, "Number of Issuers Participating in the Individual Health Insurance Marketplaces," accessed October 3, 2017
- ↑ Robert Wood Johnson Foundation, "The Skinny on Narrow Networks in Health Insurance Marketplace Plans," June 2015
- ↑ McKinsey & Company, "Hospital networks: Evolution of the configurations on the 2015 exchanges," April 2015
- ↑ Kaiser Health News, "‘Narrow Networks’ Trigger Push-Back From State Officials," November 25, 2013
- ↑ Georgetown University Health Policy Institute, "ACA Implications for State Network Adequacy Standards," August 2013
- ↑ The Commonwealth Fund, "Implementing the Affordable Care Act State Regulation of Marketplace Plan Provider Networks," May 5, 2015
- ↑ Cite error: Invalid
<ref>tag; no text was provided for refs namedgaoconcierge - ↑ 73.0 73.1 The Heritage Foundation, "Direct Primary Care: An Innovative Alternative to Conventional Health Insurance," August 6, 2014
- ↑ National Opinion Research Center, "Retainer‐Based Physicians: Characteristics, Impact, and Policy Considerations," March 2010
- ↑ 75.0 75.1 American Academy of Private Physicians, "Direct Primary Care Offers Affordability in Private Medicine," December 22, 2014
- ↑ California HealthCare Foundation, "On Retainer: Direct Primary Care Practices Bypass Insurance," April 2013
- ↑ TIME, "Medicine Is About to Get Personal," December 22, 2014
- ↑ Kansas Health Institute, "Direct primary care not subject to state insurance regulation under new law," May 14, 2015
- ↑ American Medical News, "West Virginia looks at retainer model," January 2, 2006
- ↑ ReminderCall.com, "Direct Primary Care State Laws," June 11, 2015
- ↑ Centers for Medicare and Medicaid Services, "List of Health Insurers Owing Rebates in 2012," November 26, 2012
- ↑ The Henry J. Kaiser Family Foundation, "Insurer Rebates under the Medical Loss Ratio: 2012 Estimates," April 2012
- ↑ Centers for Medicare and Medicaid Services, "2012 Total Rebates," August 1, 2013
- ↑ Centers for Medicare and Medicaid Services, "2013 MLR Refunds by State," June 30, 2014
- ↑ United States Census Bureau, "Health Insurance Coverage in the United States: 2014," September 16, 2015
- ↑ United States Census Bureau, "Health Insurance Coverage Status and Type of Coverage by State--All Persons: 1999 to 2012," accessed November 4, 2015
- ↑ National Conference of State Legislatures, "State Actions to Address Health Insurance Exchanges," accessed November 8, 2017
- ↑ Henry J. Kaiser Family Foundation, "Total Marketplace Enrollment and Financial Assistance," accessed November 8, 2017
- ↑ Henry J. Kaiser Family Foundation, "Estimated Total Premium Tax Credits Received by Marketplace Enrollees," accessed November 8, 2017