Help us improve in just 2 minutes—share your thoughts in our reader survey.
Alaska school board elections, 2015
| Alaska's 2015 elections School boards • Municipal • Candidate ballot access |
2016 →
← 2014
|
Candidate filing dates • Finance reporting • Poll opening and closing times |
A total of three Alaska school districts among America's largest school districts by enrollment held elections in 2015 for eight seats. One election was held April 7, 2015, and two were held October 6, 2015.
Here are several quick facts about Alaska's school board elections in 2015:
- The largest school district by enrollment with an election in 2015 was Anchorage School District with 48,790 K-12 students.
- The smallest school district by enrollment with an election in 2015 was Fairbanks North Star Borough School District with 14,378 K-12 students.
- Anchorage School District and Matanuska-Susitna Borough School District had the most seats on the ballot in 2015 with three seats up for election each.
- Fairbanks North Star Borough School District had the fewest seats on the ballot in 2015 with two seats up for election.
The districts listed below served 80,652 K-12 students during the 2012-2013 school year, according to the National Center for Education Statistics.[1] Click on the district names for more information on the district and its school board elections.
| 2015 Alaska School Board Elections | ||||
|---|---|---|---|---|
| District | Date | Seats up for election | Total board seats | Student enrollment |
| Anchorage School District | 4/7/2015 | 3 | 7 | 48,790 |
| Fairbanks North Star Borough School District | 10/6/2015 | 2 | 7 | 14,378 |
| Matanuska-Susitna Borough School District | 10/6/2015 | 3 | 7 | 17,484 |
Trends in Alaska school board elections

- See also: School boards in session: 2015 in brief
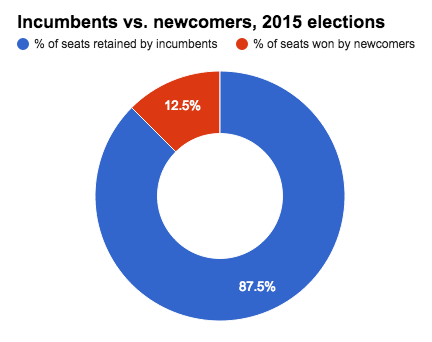
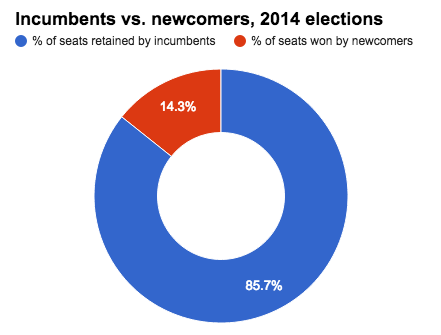
The 2015 school board elections in Alaska's largest school districts attracted fewer candidates than the state's 2014 school board elections. Both years saw a similar number of seats on the ballot go unopposed, and they had similar success rates for newcomers. In 2015, half of the seats were unopposed, and newcomers won 12.50 percent of the seats. The 2014 school board elections saw 42.86 percent of seats go unopposed. Newcomers won 14.29 percent of the seats on the ballot that year.
The following sections analyze competitiveness and incumbency advantage in Alaska's school board elections. These districts did not utilize primary or runoff elections. Winners only had to receive a plurality, or relative majority, of votes to secure a seat. All of the school board elections held in the state in 2014 and 2015 were nonpartisan.
Details of the data discussed here can be found in the table below.
Competitiveness
School board elections held in the state's largest school districts attracted an average of 1.5 candidates in 2015. This was lower than 2014 average of 1.86 candidates per seat on the ballot. Four of the eight seats up for election in 2015 went unopposed, and three of the seven seats on the ballot were unopposed in 2014.
Incumbency advantage
School board incumbents in 2015 had a 100 percent success rate. Seven of the eight incumbents whose terms were up for re-election ran to retain their seats. All seven of them won the election, with four of them running unopposed and three of them defeating challengers.
In 2014, 85.71 percent of incumbents who ran for re-election retained their seats. All seven incumbents whose seats were on the ballot ran for re-election, and six of them won another term. Three of the incumbents ran unopposed, but the other four faced challengers. Three of those who faced challengers won re-election, and the other was defeated.
The map below details the success rates for incumbents who ran in the 2015 school board elections that were held in the largest school districts by enrollment in the U.S.
The map above details the success rates of incumbent who ran to retain their school board seats in the largest school districts in each state. States depicted in gray did not hold school board elections.
Data table
The table below displays the statistics for school board elections in Alaska's largest school districts from 2014 to 2015.
| Alaska school board elections, 2014-2015 | ||||||||||
|---|---|---|---|---|---|---|---|---|---|---|
| Year | Total | Incumbents | ||||||||
| Seats up | Candidates | Candidates/ seat |
Unopposed seats | % unopposed | % seats won by newcomers | Sought re-election | Unopposed | Retained | % retained | |
| 2015 | 8 | 12 | 1.50 | 4 | 50.00% | 12.50% | 7 | 4 | 7 | 100.00% |
| 2014 | 7 | 13 | 1.86 | 3 | 42.86% | 14.29% | 7 | 3 | 6 | 85.71% |
Survey responses
Four of the 12 candidates running for a school board seat in Alaska's largest school districts in the 2015 elections responded to Ballotpedia's school board candidate survey. The following sections display their answers to questions about top priorities and education issues.
Top priorities

When asked what her top priorities would be if elected, Tam Agosti-Gisler, Seat F incumbent of the Anchorage School Board, stated:
| “ | Implementation of our CTE initatives Expansion of our optional programs, particularly in language immersion |
” |
| —Tam Agosti-Gisler (2015)[3] | ||

Anchorage School Board Seat F challenger David Nees stated the following as his top priorities:
| “ | Budget, teacher retention.[2] | ” |
| —David Nees (2015)[4] | ||

The top priorities for Seat B incumbent on the Matanuska-Susitna Borough School Board Sarah Welton were:
| “ | I do not have an opponent. My top priority is to reduce class sizes and ensure opportunities for students to work on their priorities for career and college readiness. The need for critical thinking and social emotional intelligence is needed in school is noted by employers and college professors so I would enhance and support the programs we have in those areas.[2] | ” |
| —Sarah Welton (2015)[5] | ||

When asked what his top priorities would be if elected, Wade Long, challenger for Seat E on the Matanuska-Susitna Borough School Board, stated:
| “ | Implementing a sweeping tutoring and support program in schools starting at the lowest grade levels to infuse learning. This will also address hurdles at the lower grade levels that may interfere with learning. Like parental coaching or counseling troubled kids. Then provide tutoring in the middle grades. At the upper grades work businesses, the community, military, unions and the state college to get internships, scholarships and real world training and actual college credit to prepare young adults, not older kids.[2] | ” |
| —Wade Long (2015)[6] | ||
Ranking the issues
The candidates were asked to rank the following issues by importance in the school district, with 1 being the most important and 7 being the least important. This table displays the candidates' average rankings as well as the highest and lowest rankings for each issue.
| Issue importance ranking | |||
|---|---|---|---|
| Issues | Average ranking | Highest ranking | Lowest ranking |
| Expanding arts education | 3 | 1 | 6 |
| Expanding career-technical education | 4.25 | 3 | 5 |
| Balancing or maintaining the district's budget | 5 | 1 | 7 |
| Improving college readiness | 4.25 | 2 | 7 |
| Closing the achievement gap | 2.75 | 1 | 6 |
| Improving education for special needs students | 4 | 3 | 6 |
| Expanding school choice options | 4.75 | 3 | 7 |
Positions on the issues
The candidates were asked an additional 10 short answer and multiple choice questions regarding significant issues in education. Links to those responses can be found below.
- Tam Agosti-Gisler survey responses
- David Nees survey responses
- Sarah Welton's survey responses
- Wade Long's survey responses
State profile
| Demographic data for Alaska | ||
|---|---|---|
| Alaska | U.S. | |
| Total population: | 737,709 | 316,515,021 |
| Land area (sq mi): | 570,641 | 3,531,905 |
| Race and ethnicity** | ||
| White: | 66% | 73.6% |
| Black/African American: | 3.4% | 12.6% |
| Asian: | 5.9% | 5.1% |
| Native American: | 13.8% | 0.8% |
| Pacific Islander: | 1.2% | 0.2% |
| Two or more: | 8.4% | 3% |
| Hispanic/Latino: | 6.5% | 17.1% |
| Education | ||
| High school graduation rate: | 92.1% | 86.7% |
| College graduation rate: | 28% | 29.8% |
| Income | ||
| Median household income: | $72,515 | $53,889 |
| Persons below poverty level: | 11.3% | 11.3% |
| Source: U.S. Census Bureau, "American Community Survey" (5-year estimates 2010-2015) Click here for more information on the 2020 census and here for more on its impact on the redistricting process in Alaska. **Note: Percentages for race and ethnicity may add up to more than 100 percent because respondents may report more than one race and the Hispanic/Latino ethnicity may be selected in conjunction with any race. Read more about race and ethnicity in the census here. | ||
Presidential voting pattern
- See also: Presidential voting trends in Alaska
Alaska voted Republican in all seven presidential elections between 2000 and 2024.
More Alaska coverage on Ballotpedia
- Elections in Alaska
- United States congressional delegations from Alaska
- Public policy in Alaska
- Endorsers in Alaska
- Alaska fact checks
- More...
Academic performance
- See also: Public education in Alaska
| Education terms |
|---|
| For more information on education policy terms, see this article. |
NAEP scores
- See also: NAEP scores by state
The National Center for Education Statistics provides state-by-state data on student achievement levels in mathematics and reading in the National Assessment of Educational Progress (NAEP). Compared to its relative neighbors, fourth grade students in Alaska tied with California for the lowest percentage (27 percent) scoring at or above proficient in reading during the 2012-2013 school year.
The table and chart below show the percentage of students in Alaska and its neighboring states who were proficient or above proficient in math and reading in fourth grade and eighth grade during the 2012-2013 school year.[7]
| Percent of students scoring at or above proficient, 2012-2013 | ||||
|---|---|---|---|---|
| Math - Grade 4 | Math - Grade 8 | Reading - Grade 4 | Reading - Grade 8 | |
| Alaska | 37% | 33% | 27% | 31% |
| California | 33% | 28% | 27% | 29% |
| Oregon | 40% | 34% | 33% | 37% |
| Washington | 48% | 42% | 40% | 42% |
| U.S. average | 41% | 34% | 34% | 34% |
| Source: United States Department of Education, ED Data Express, "State Tables" | ||||
Graduation, ACT and SAT scores
The following table shows the graduation rates and average composite ACT and SAT scores for Alaska and surrounding states during the 2012-2013 school year. All statements made in this section refer to that school year.[8][9][10]
In the United States, public schools reported graduation rates that averaged to about 81.4 percent. About 54 percent of all students in the country took the ACT, while 50 percent reported taking the SAT. The average national composite scores for those tests were 20.9 out of a possible 36 for the ACT and 1,498 out of a possible 2,400 for the SAT.[11]
Alaska schools reported a graduation rate of 71.8 percent, second-lowest among its neighboring states.
In Alaska, more students took the SAT than the ACT, earning an average SAT score of 1,495.
| Comparison table for graduation rates and test scores, 2012-2013 | |||||||
|---|---|---|---|---|---|---|---|
| State | Graduation rate, 2013 | Average ACT composite, 2013 | Average SAT composite, 2013 | ||||
| Percent | Quintile ranking** | Score | Participation rate | Score | Participation rate | ||
| Alaska | 71.8% | Fifth | 21.1 | 37% | 1,495 | 52% | |
| California | 80.4% | Third | 22.2 | 26% | 1,505 | 57% | |
| Oregon | 68.7% | Fifth | 21.5 | 34% | 1,539 | 49% | |
| Washington | 76.4% | Fourth | 22.8 | 21% | 1,537 | 60% | |
| U.S. averages | 81.4% | 20.9 | 54% | 1,498 | 50% | ||
| **Graduation rates for states in the first quintile ranked in the top 20 percent nationally. Similarly, graduation rates for states in the fifth quintile ranked in the bottom 20 percent nationally. Sources: United States Department of Education, "ED Data Express" ACT.org, "2013 ACT National and State Scores," accessed May 28, 2015 The Commonwealth Foundation, "SAT scores by state, 2013" | |||||||
Dropout rate
- See also: Public high school dropout rates by state for a full comparison of dropout rates by group in all states
The high school event dropout rate indicates the proportion of students who were enrolled at some time during the school year and were expected to be enrolled in grades 9–12 in the following school year but were not enrolled by October 1 of the following school year. Students who have graduated, transferred to another school, died, moved to another country, or who are out of school due to illness are not considered dropouts. The average public high school event dropout rate for the United States remained constant at 3.3 percent for both school year 2010–11 and school year 2011–12. The event dropout rate for Alaska was higher than the national average at 6.9 percent in the 2010-2011 school year, and 7.0 percent in the 2011-2012 school year.[12]
See also
| Alaska | School Boards | News and Analysis |
|---|---|---|
 |
 | |
Footnotes
- ↑ National Center for Education Statistics, "Elementary/Secondary Information System," accessed April 20, 2014
- ↑ 2.0 2.1 2.2 2.3 Note: This text is quoted verbatim from the original source. Any inconsistencies are attributable to the original source.
- ↑ Ballotpedia School Board Candidate Survey, 2015, "Tam Agosti-Gisler responses," February 26, 2015
- ↑ Ballotpedia School Board Candidate Survey, 2015, "David Nees responses," March 30, 2015
- ↑ Ballotpedia School Board Candidate Survey, 2015, "Sarah Welton's responses," September 14, 2015
- ↑ Ballotpedia School Board Candidate Survey, 2015, "Wade Long's responses," September 30, 2015
- ↑ National Center for Education Statistics, "State Profiles," accessed May 12, 2014
- ↑ United States Department of Education, ED Data Express, "State Tables," accessed May 13, 2014
- ↑ ACT, "2012 ACT National and State Scores," accessed May 13, 2014
- ↑ Commonwealth Foundation, "SAT Scores by State 2013," October 10, 2013
- ↑ StudyPoints, "What's a good SAT score or ACT score?" accessed June 7, 2015
- ↑ United States Department of Education, National Center for Education Statistics, "Common Core of Data (CCD), State Dropout and Graduation Rate Data File, School Year 2010-11, Provision Version 1a and School Year 2011-12, Preliminary Version 1a," accessed May 13, 2014
| |||||