Help us improve in just 2 minutes—share your thoughts in our reader survey.
Arizona state executive official elections, 2014
2015 →
← 2013
|
| 2014 State Executive Official Elections |
| Alabama • Alaska • Arizona • Arkansas • California • Colorado • Connecticut • Delaware • Florida • Georgia • Hawaii • Idaho • Illinois • Indiana • Iowa • Kansas • Louisiana • Maine • Maryland • Massachusetts • Michigan • Minnesota • Missouri • Montana • Nebraska • Nevada • New Hampshire • New Mexico • New York • North Dakota • Ohio • Oklahoma • Oregon • Pennsylvania • Rhode Island • South Carolina • South Dakota • Tennessee • Texas • Utah • Vermont • Wisconsin • Wyoming |
| Partisan breakdown Candidates by office Voter turnout Key deadlines State executive organization Ballotpedia reports Recent news See also |
| News • Calendar |
Eight state executive positions were up for election in 2014 in the state of Arizona. The general election took place November 4, 2014, following a primary on August 26.
A primary election is an election in which registered voters select a candidate that they believe should be a political party's candidate for elected office to run in the general election. They are also used to choose convention delegates and party leaders. Primaries are state-level and local-level elections that take place prior to a general election. Arizona utilizes a semi-closed primary system. Unaffiliated voters may choose which party's primary they will vote in, but voters registered with a party can only vote in that party's primary.[1][2][3]
For information about which offices are nominated via primary election, see this article.
The following offices were elected in 2014 in Arizona:
- Governor of Arizona
- Arizona Attorney General
- Arizona Secretary of State
- Arizona Treasurer
- Arizona Superintendent of Public Instruction
- Arizona Corporation Commission (2 positions)
- Arizona Mine Inspector
In addition to candidate lists and election results, this page includes information about important dates, how the state's executive branch is organized, as well as links to articles about recent news in races across the state.
Partisan breakdown
Heading into the November 4 election, the Republican Party held eight of the eight state executive seats in Arizona.
| Arizona State Executives -- Partisan Breakdown | |||
|---|---|---|---|
| Party | As of November 4, 2014 | After the 2014 Election | |
| Republican Party | 8 | 8 | |
| Democratic Party | 0 | 0 | |
| Total | 8 | 8 | |
Candidates by office


**Note: Asterisk (*) denotes no party affiliation
Primary results
Governor
Republican primary
| Governor of Arizona Republican Primary, 2014 | ||||
|---|---|---|---|---|
| Candidate | Vote % | Votes | ||
| 37.2% | 200,607 | |||
| Scott Smith | 22.1% | 119,107 | ||
| Christine Jones | 16.7% | 89,922 | ||
| Ken Bennett | 11.5% | 62,010 | ||
| Andrew Thomas | 8.1% | 43,822 | ||
| Frank Riggs | 4.5% | 24,168 | ||
| Mike Aloisi (Write-in) | 0% | 27 | ||
| Alice Lukasik (Write-in) | 0% | 27 | ||
| Total Votes | 539,690 | |||
| Election results via Arizona Secretary of State. | ||||
Democratic primary
- Uncontested
Attorney General
Republican primary
| Arizona Attorney General, Republican Primary, 2014 | ||||
|---|---|---|---|---|
| Candidate | Vote % | Votes | ||
| 53.7% | 279,855 | |||
| Tom Horne Incumbent | 46.3% | 240,858 | ||
| Total Votes | 520,713 | |||
| Election results via Arizona Secretary of State. | ||||
Democratic primary
- Uncontested
Secretary of State
Republican primary
| Arizona Secretary of State, Republican Primary, 2014 | ||||
|---|---|---|---|---|
| Candidate | Vote % | Votes | ||
| 43.2% | 217,741 | |||
| Justin Pierce | 34.6% | 174,422 | ||
| Wil Cardon | 22.1% | 111,444 | ||
| Total Votes | 503,607 | |||
| Election results via Arizona Secretary of State. | ||||
Democratic primary
- Uncontested
Treasurer
Republican primary
| Arizona Treasurer Republican Primary, 2014 | ||||
|---|---|---|---|---|
| Candidate | Vote % | Votes | ||
| 45% | 215,892 | |||
| Hugh Hallman | 32.5% | 155,775 | ||
| Randy Pullen | 22.5% | 108,106 | ||
| Total Votes | 479,773 | |||
| Election results via Arizona Secretary of State. | ||||
Democratic primary
- Uncontested
Superintendent of Public Instruction
Republican primary
| Arizona Superintendent of Public instruction, Republican Primary, 2014 | ||||
|---|---|---|---|---|
| Candidate | Vote % | Votes | ||
| 58.4% | 290,719 | |||
| John Huppenthal Incumbent | 41.6% | 206,744 | ||
| Total Votes | 497,463 | |||
| Election results via Arizona Secretary of State. | ||||
Democratic primary
| Arizona Superintendent of Public instruction, Democratic Primary, 2014 | ||||
|---|---|---|---|---|
| Candidate | Vote % | Votes | ||
| 53.9% | 157,233 | |||
| Sharon Thomas | 46.1% | 134,310 | ||
| Total Votes | 291,543 | |||
| Election results via Arizona Secretary of State. | ||||
Corporation Commissioner
Republican primary
| Arizona Corporation Commission, Republican Primary (Elect 2), 2014 | ||||
|---|---|---|---|---|
| Candidate | Vote % | Votes | ||
| 29% | 250,193 | |||
| 28.9% | 249,951 | |||
| Lucy Mason | 23.1% | 199,821 | ||
| Vernon Parker | 19% | 163,773 | ||
| Total Votes | 863,738 | |||
| Election results via Arizona Secretary of State. | ||||
Democratic primary
- Uncontested
Mine Inspector
Republican primary
- Uncontested
Democratic primary
- Uncontested
General election results
The general election took place on November 4, 2014.
Governor
| Governor of Arizona, 2014 | ||||
|---|---|---|---|---|
| Party | Candidate | Vote % | Votes | |
| Republican | 53.4% | 805,062 | ||
| Democratic | Fred DuVal | 41.6% | 626,921 | |
| Libertarian | Barry J. Hess | 3.8% | 57,337 | |
| Americans Elect | J.L. Mealer | 1% | 15,432 | |
| Nonpartisan | Write-ins | 0.1% | 1,664 | |
| Total Votes | 1,506,416 | |||
| Election results via Arizona Secretary of State | ||||
Attorney General
| Attorney General of Arizona, 2014 | ||||
|---|---|---|---|---|
| Party | Candidate | Vote % | Votes | |
| Republican | 52.9% | 782,361 | ||
| Democratic | Felecia Rotellini | 47.1% | 696,054 | |
| Nonpartisan | Anthony Camboni (Write-in) | 0% | 265 | |
| Total Votes | 1,478,680 | |||
| Election results via Arizona Secretary of State | ||||
Secretary of State
| Secretary of State of Arizona, 2014 | ||||
|---|---|---|---|---|
| Party | Candidate | Vote % | Votes | |
| Republican | 52.2% | 779,226 | ||
| Democratic | Terry Goddard | 47.8% | 712,918 | |
| Total Votes | 1,492,144 | |||
| Election results via Arizona Secretary of State | ||||
Treasurer
Jeff DeWit ran unopposed for election.
Superintendent of Public Instruction
| Superintendent of Arizona, 2014 | ||||
|---|---|---|---|---|
| Party | Candidate | Vote % | Votes | |
| Republican | 50.5% | 740,273 | ||
| Democratic | David Garcia | 49.5% | 724,239 | |
| Total Votes | 1,464,512 | |||
| Election results via Arizona Secretary of State | ||||
Corporation Commissioner
| Arizona Corporation Commission, 2014 | ||||
|---|---|---|---|---|
| Party | Candidate | Vote % | Votes | |
| Republican | 28.8% | 766,864 | ||
| Republican | 28.6% | 761,915 | ||
| Democratic | Sandra Kennedy | 21.6% | 576,482 | |
| Democratic | Jim Holway | 20.9% | 557,963 | |
| Nonpartisan | Write-in votes | 0% | 529 | |
| Total Votes | 2,663,753 | |||
| Election results via Arizona Secretary of State | ||||
Mine Inspector
Joe Hart ran unopposed for re-election.
Voter turnout
Political scientist Michael McDonald's United States Elections Project studied voter turnout in the 2014 election by looking at the percentage of eligible voters who headed to the polls. McDonald used voting-eligible population (VEP), or the number of eligible voters independent of their current registration status, to calculate turnout rates in each state on November 4. He also incorporated ballots cast for the highest office in each state into his calculation. He estimated that 81,687,059 ballots were cast in the 50 states plus the District of Columbia, representing 35.9 percent of the VEP.[8] By comparison, 61.6 percent of VEP voted in the 2008 presidential election and 58.2 percent of VEP voted in the 2012 presidential election.[9]
Quick facts
- According to PBS Newshour, voter turnout in the 2014 midterms was the lowest since the 1942 midterms, which took place during the nation's involvement in World War II.[10]
- Forty-three states and the District of Columbia did not surpass 50 percent turnout in McDonald's analysis.
- The three states with the lowest turnout according to McDonald's analysis were Texas (28.3 percent), Tennessee (28.6 percent), and Indiana (28.8 percent).
- Maine (58.5 percent), Wisconsin (56.5 percent), and Colorado (54.5 percent) were the three states with the highest turnout.
- Twelve states increased voter turnout in 2014 compared to the 2010 midterm elections.[11]
| Voter turnout rates, 2014 | |||||
|---|---|---|---|---|---|
| State | Total votes counted | % voter eligible population | Top statewide office up for election | Size of lead (Raw votes) | Size of lead (%) |
| Alabama | 1,191,274 | 33.2 | Governor | 320,319 | 27.2 |
| Alaska | 285,431 | 54.4 | Governor | 4,004 | 1.6 |
| Arizona | 1,537,671 | 34.1 | Governor | 143,951 | 12.5 |
| Arkansas | 852,642 | 40.1 | Governor | 118,664 | 14.0 |
| California | 7,513,972 | 30.8 | Governor | 1,065,748 | 17.8 |
| Colorado | 2,080,071 | 54.5 | Governor | 50,395 | 2.4 |
| Connecticut | 1,096,509 | 42.5 | Governor | 26,603 | 2.5 |
| Delaware | 234,038 | 34.4 | Attorney General | 31,155 | 13.6 |
| District of Columbia | 177,176 | 35.8 | Mayor | 27,934 | 19.0 |
| Florida | 6,026,802 | 43.3 | Governor | 66,127 | 1.1 |
| Georgia | 2,596,947 | 38.5 | Governor | 202,685 | 8.0 |
| Hawaii | 369,554 | 36.5 | Governor | 45,323 | 12.4 |
| Idaho | 445,307 | 39.6 | Governor | 65,852 | 14.9 |
| Illinois | 3,680,417 | 40.9 | Governor | 171,900 | 4.9 |
| Indiana | 1,387,622 | 28.8 | Secretary of State | 234,978 | 17.8 |
| Iowa | 1,142,284 | 50.2 | Governor | 245,548 | 21.8 |
| Kansas | 887,023 | 43.4 | Governor | 33,052 | 3.9 |
| Kentucky | 1,435,868 | 44.0 | U.S. Senate | 222,096 | 15.5 |
| Louisiana | 1,472,039 | 43.8 | U.S. Senate | 16,401 | 1.1 |
| Maine | 616,996 | 58.5 | Governor | 29,820 | 4.9 |
| Maryland | 1,733,177 | 41.5 | Governor | 88,648 | 6.1 |
| Massachusetts | 2,186,789 | 44.6 | Governor | 40,361 | 1.9 |
| Michigan | 3,188,956 | 43.2 | Governor | 129,547 | 4.3 |
| Minnesota | 1,992,613 | 50.5 | Governor | 109,776 | 5.6 |
| Mississippi | 631,858 | 28.9 | U.S. Senate | 141,234 | 33.0 |
| Missouri | 1,426,303 | 31.8 | Auditor | 684,074 | 53.6 |
| Montana | 373,831 | 47.3 | U.S. Senate | 65,262 | 17.9 |
| Nebraska | 552,115 | 41.5 | Governor | 97,678 | 18.7 |
| Nevada | 547,349 | 29.0 | Governor | 255,793 | 46.7 |
| New Hampshire | 495,565 | 48.4 | Governor | 24,924 | 5.2 |
| New Jersey | 1,955,042 | 32.5 | N/A | N/A | N/A |
| New Mexico | 512,805 | 35.7 | Governor | 73,868 | 14.6 |
| New York | 3,930,310 | 29.0 | Governor | 476,252 | 13.4 |
| North Carolina | 2,939,767 | 41.2 | U.S. Senate | 48,511 | 1.7 |
| North Dakota | 255,128 | 45.0 | U.S. House At-large seat | 42,214 | 17.1 |
| Ohio | 3,149,876 | 36.2 | Governor | 933,235 | 30.9 |
| Oklahoma | 824,831 | 29.8 | Governor | 122,060 | 14.7 |
| Oregon | 1,541,782 | 53.5 | Governor | 59,029 | 4.5 |
| Pennsylvania | 3,495,866 | 36.0 | Governor | 339,261 | 9.8 |
| Rhode Island | 329,212 | 42.2 | Governor | 14,346 | 4.5 |
| South Carolina | 1,261,611 | 35.2 | Governor | 179,089 | 14.6 |
| South Dakota | 282,291 | 44.9 | Governor | 124,865 | 45.1 |
| Tennessee | 1,374,065 | 28.6 | Governor | 642,214 | 47.5 |
| Texas | 4,727,208 | 28.3 | Governor | 957,973 | 20.4 |
| Utah | 577,973 | 30.2 | Attorney General | 173,819 | 35.2 |
| Vermont | 193,087 | 38.8 | Governor | 2,095 | 1.1 |
| Virginia | 2,194,346 | 36.6 | U.S. Senate | 16,727 | 0.8 |
| Washington | 2,123,901 | 43.1 | N/A | N/A | N/A |
| West Virginia | 451,498 | 31.2 | U.S. Senate | 124,667 | 27.6 |
| Wisconsin | 2,410,314 | 56.5 | Governor | 137,607 | 5.7 |
| Wyoming | 168,390 | 39.3 | Governor | 52,703 | 33.6 |
Note: Information from the United States Elections Project was last updated on December 16, 2014.
Key deadlines
| Deadline | Event |
|---|---|
| May 28, 2014 | Filing deadline for major party candidates |
| July 17, 2014 | Filing deadline for write-in candidates (Primary) |
| August 26, 2014 | Primary election |
| September 25, 2014 | Filing deadline for write-in candidates (General) |
| November 4, 2014 | General election |
| December 1, 2014 | Official Canvass of general election results |
| January 5, 2015 | Inauguration day for state executive officials in general election |
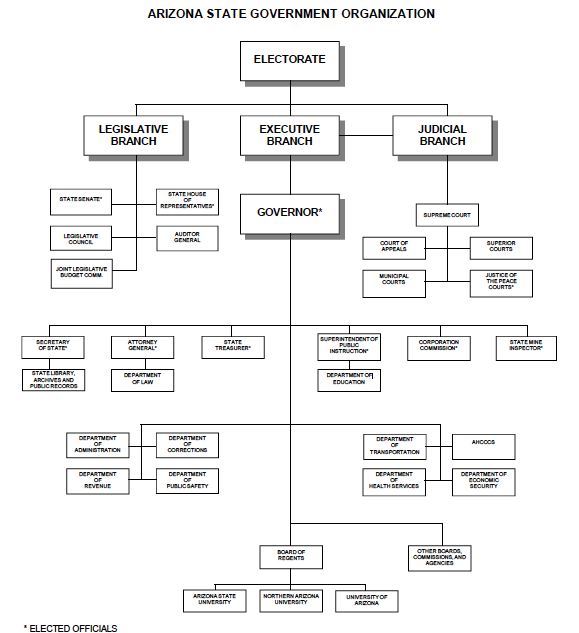
State executive organization
Executive officials in Arizona are part of a three-pronged government structure that includes state legislators and state judges. The following chart details the relationship among different branches of Arizona's state government:
Ballotpedia reports
To learn more about developments in these races, check out the following news articles from Ballotpedia:
Recent news
This section links to a Google news search for the term "Arizona + State + Executive +-Obama + Elections"
See also

Footnotes
- ↑ National Conference of State Legislatures, "State Primary Election Types," accessed July 19, 2024
- ↑ Citizens Clean Elections Commission, "Primary Election," accessed July 19, 2024
- ↑ Arizona State Legislature, "Arizona Revised Statutes 16-467," accessed July 19 2024
- ↑ Eastern Arizona Courier, "Bennett announces candidacy," September 17, 2013
- ↑ azcentral.com, "Arizona candidates file nominating petitions," May 23, 2014
- ↑ Doug Ducey for Governor 2014 Official campaign website, "Homepage," accessed September 1, 2013
- ↑ azcentral.com, "Burns won't seek 2nd term on Corporation Commission," April 19, 2013
- ↑ United States Elections Project, "2014 November General Election Turnout Rates," November 7, 2014
- ↑ TIME, "Voter Turnout in Midterm Elections Hits 72-Year Low," November 10, 2014
- ↑ PBS, "2014 midterm election turnout lowest in 70 years," November 10, 2014
- ↑ U.S. News & World Report, "Midterm Turnout Down in 2014," November 5, 2014
