Virginia's 11th Congressional District elections, 2012
2014 →
|
 |
November 6, 2012 |
June 12, 2012 |
Gerald Connolly |
Gerald Connolly |
 |
 |
The 11th Congressional District of Virginia held an election for the U.S. House of Representatives on November 6, 2012.
Gerald Connolly was re-elected on November 6, 2012.[1]
| Candidate Filing Deadline | Primary Election | General Election |
|---|---|---|
Primary: Virginia has an open primary system, in which any registered voter may choose which party's primary to vote in.
Voter registration: Voters had to register to vote in the primary by May 21, 2012. For the general election, the voter registration deadline was October 15, 2012.[2]
- See also: Virginia elections, 2012
Incumbent: Heading into the election the incumbent was Gerald Connolly (D), who was first elected to the House in 2008.
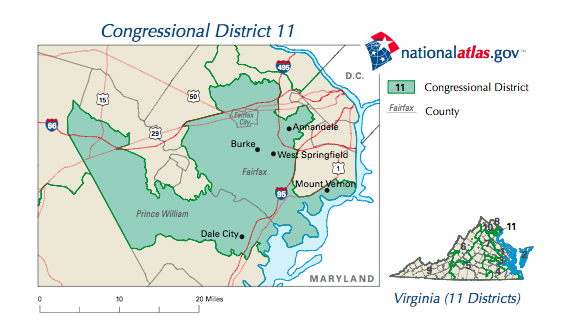
This was the first election which used new district maps based on 2010 Census data. Virginia's 11th Congressional District is located in the northern portion of the state, and includes parts of Prince William and Fairfax counties.[3]
Candidates
Note: Election results were added on election night as races were called. Vote totals were added after official election results had been certified. Click here for more information about Ballotpedia's election coverage plan. Please contact us about errors in this list.
General election candidates
June 12, 2012, primary results
|
|
|
|
|
Election results
General Election
| Party | Candidate | Vote % | Votes | |
|---|---|---|---|---|
| Democratic | 61% | 202,606 | ||
| Republican | Chris Perkins | 35.5% | 117,902 | |
| Green | Joe Galdo | 0.7% | 2,195 | |
| Independent | Peter Marchetti | 0.6% | 1,919 | |
| Independent | Chris DeCarlo | 0.9% | 3,027 | |
| Independent | Mark Gibson | 1.1% | 3,806 | |
| Write-In | N/A | 0.2% | 788 | |
| Total Votes | 332,243 | |||
| Source: Virginia State Board of Elections "Official Election Results, 2012 General Election" | ||||
Impact of redistricting
- See also: Redistricting in Virginia
Following the 2010 Census, Virginia was redistricted. The state remained at 11 congressional seats. Redistricting plans were not solidified by the end of the 2011 session of the Virginia General Assembly.
In redistricting, The Hill published a list of the Top Ten House Members who were helped by redistricting.[6] Gerald Connolly ranked 8th on the list.[6] The article notes that Connolly inadvertently benefited from a Republican plan to build up Republican incumbent districts in the redistricting process. Connolly's 11th District lost portions of its Republican base to neighboring Frank Wolf's 10th District, resulting in a more Democratic district for Connolly.[6].
The 11th District was re-drawn after the 2010 Census. The new district is composed of the following percentages of voters of the old congressional districts.[7][8]
- 4 percent from the 1st Congressional District
- 12 percent from the 8th Congressional District
- 10 percent from the 10th Congressional District
- 73 percent from the 11th Congressional District
District partisanship
FairVote's Monopoly Politics 2012 study
- See also: FairVote's Monopoly Politics 2012
In 2012, FairVote did a study on partisanship in the congressional districts, giving each a percentage ranking (D/R) based on the new 2012 maps and comparing that to the old 2010 maps. Virginia's 11th District became more Democratic because of redistricting.[9]
- 2012: 59D / 41R
- 2010: 54D / 46R
Cook Political Report's PVI
In 2012, Cook Political Report released its updated figures on the Partisan Voter Index, which measures each congressional district's partisanship relative to the rest of the country. Virginia's 11th Congressional District has a PVI of D+7, which is the 126th most Democratic district in the country. In 2008, this district was won by Barack Obama (D), 63-37 percent over John McCain (R). In 2004, John Kerry (D) won the district 54-46 percent over George W. Bush (R).[10]
Campaign contributions
Candidates for Congress were required to file up to seven main reports with the Federal Election Commission during the 2012 elections season. Below are the candidate's reports.
Gerald Connolly
| Gerald Connolly Campaign Finance Reports | |||||||||
|---|---|---|---|---|---|---|---|---|---|
| Report | Date Filed | Beginning Balance | Total Contributions for Reporting Period | Expenditures | Cash on Hand | ||||
| April Quarterly[11] | April 15, 2012 | $731,868.72 | $400,250.74 | $(116,005.33) | $1,016,114.13 | ||||
| July Quarterly[12] | July 15, 2012 | $1,044,235.77 | $171,887.77 | $(42,040.33) | $1,174,083.21 | ||||
| Running totals | |||||||||
| $572,138.51 | $(158,045.66) | ||||||||
Chris Perkins
| Chris Perkins Campaign Finance Reports | |||||||||
|---|---|---|---|---|---|---|---|---|---|
| Report | Date Filed | Beginning Balance | Total Contributions for Reporting Period | Expenditures | Cash on Hand | ||||
| April Quarterly[13] | April 15, 2012 | $46,763.58 | $73,760.39 | $(35,162.74) | $85,361.23 | ||||
| July Quarterly[14] | July 15, 2012 | $60,340.78 | $40,603.76 | $(56,513.67) | $44,430.87 | ||||
| Running totals | |||||||||
| $114,364.15 | $(91,676.41) | ||||||||
Joe Galdo
| Joe Galdo Campaign Finance Reports | |||||||||
|---|---|---|---|---|---|---|---|---|---|
| Report | Date Filed | Beginning Balance | Total Contributions for Reporting Period | Expenditures | Cash on Hand | ||||
| April Quarterly[15] | April 15, 2012 | $100 | $207.46 | $(207.46) | $100 | ||||
| July Quarterly[16] | July 15, 2012 | $100 | $4,456.22 | $(2,685.22) | $1,871 | ||||
| Running totals | |||||||||
| $4,663.68 | $(2,892.68) | ||||||||
District history
| Candidate ballot access |
|---|
 |
| Find detailed information on ballot access requirements in all 50 states and Washington, D.C. |
2010
On November 2, 2010, Gerry Connolly won re-election to the U.S. House of Representatives, defeating Keith S. Fimian (R), Christopher F. DeCarlo (I), David L. Dotson (L), David William Gillis, Jr. (Independent Green), and a write-in.[17]
| U.S. House of Representatives General Election, Virginia, Congressional District 11, 2010 | ||||
|---|---|---|---|---|
| Party | Candidate | Vote % | Votes | |
| Democratic | 49.2% | 111,720 | ||
| Republican | Keith S. Fimian | 48.8% | 110,739 | |
| Independent | Christopher F. DeCarlo | 0.8% | 1,846 | |
| Libertarian | David L. Dotson | 0.6% | 1,382 | |
| Independent Green | David William Gillis, Jr. | 0.4% | 959 | |
| Write-in | Unlisted | 0.1% | 305 | |
| Total Votes | 226,951 | |||
See also
- United States House of Representatives elections in Virginia, 2012
- United States House of Representatives elections, 2012
- United States Senate elections in Virginia, 2012
Footnotes
- ↑ ABC News, "2012 General Election Results," accessed November 6, 2012
- ↑ Virginia State Board of Elections, "2012 November Election Calendar," accessed July 7, 2012
- ↑ Virginia Redistricting Map, "Map" accessed September 25, 2012
- ↑ The Hill "Rep. Connolly rules out 2012 Senate run; hopes for Kaine," accessed December 6, 2011
- ↑ Politico "Perkins: Ryan plans needs better sales pitch," accessed December 6, 2011
- ↑ 6.0 6.1 6.2 The Hill, "House members most helped by redistricting," accessed April 17, 2012
- ↑ Moonshadow Mobile's CensusViewer, "Virginia's congressional districts 2001-2011 comparison"
- ↑ Labels & Lists, "VoterMapping software voter counts"
- ↑ "2011 Redistricting and 2012 Elections in Virginia," September 2012
- ↑ Cook Political Report "Partisan Voting Index Districts of the 113th Congress: 2004 & 2008" accessed October 2012
- ↑ Federal Election Commission, Gerald Connolly's April Quarterly report," accessed September 26, 2012
- ↑ Federal Election Commission, "Gerald Connolly's July Quarterly report," accessed September 26, 2012
- ↑ Federal Election Commission, Chris Perkins' April Quarterly report," accessed September 26, 2012
- ↑ Federal Election Commission, "Chris Perkins' July Quarterly report," accessed September 26, 2012
- ↑ Federal Election Commission, Joe Galdo's April Quarterly report," accessed September 26, 2012
- ↑ Federal Election Commission, "Joe Galdo's July Quarterly report," accessed September 26, 2012
- ↑ U.S. Congress House Clerk, "Statistics of the Congressional Election of November 2, 2010," accessed March 28, 2013

