Help us improve in just 2 minutes—share your thoughts in our reader survey.
New Mexico school board elections, 2015
| New Mexico's 2015 elections School boards • Municipal • Candidate ballot access |
2016 →
← 2014
|
Candidate filing dates • Finance reporting • Poll opening and closing times |
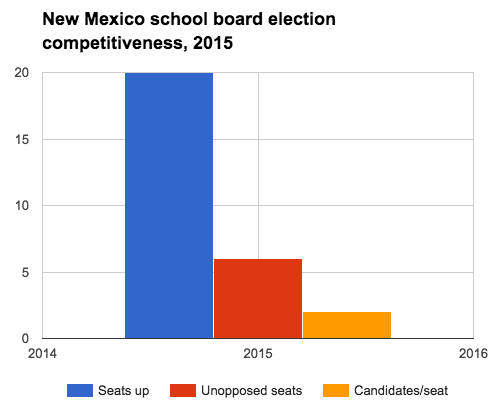
A total of eight New Mexico school districts among America's largest school districts by enrollment held elections for 20 seats in 2015. All of the elections were held February 3, 2015.
Here are several quick facts about New Mexico's school board elections in 2015:
- The largest school district by enrollment with an election in 2015 was Albuquerque Public Schools with 94,083 K-12 students.
- The smallest school district by enrollment with an election in 2015 was Roswell Independent Schools with 10,261 K-12 students.
- Four districts were tied the most seats on the ballot in 2015 with three seats up for election.
- The other four districts were tied for the fewest seats on the ballot in 2015 with two seats up for election each.
The districts listed below served 198,128 K-12 students during the 2012-2013 school year, according to the National Center for Education Statistics.[1] Click on the district names for more information on the district and its school board elections.
| 2015 New Mexico School Board Elections | ||||
|---|---|---|---|---|
| District | Date | Seats up for election | Total board seats | Student enrollment |
| Albuquerque Public Schools | 2/3/2015 | 3 | 7 | 94,083 |
| Farmington Municipal Schools | 2/3/2015 | 3 | 5 | 11,222 |
| Gadsden Independent Schools | 2/3/2015 | 3 | 5 | 13,957 |
| Gallup-McKinley County Schools | 2/3/2015 | 2 | 5 | 12,033 |
| Las Cruces Public Schools | 2/3/2015 | 2 | 5 | 25,384 |
| Rio Rancho Public Schools | 2/3/2015 | 2 | 5 | 16,884 |
| Roswell Independent Schools | 2/3/2015 | 2 | 5 | 10,261 |
| Santa Fe Public Schools | 2/3/2015 | 3 | 5 | 14,304 |
Trends in New Mexico school board elections
- See also: School boards in session: 2015 in brief
The 2015 school board elections in the state saw a higher number of candidates run per seat than the 2015 average across the United States, and they saw a lower percentage of unopposed seats. Newcomers fared better in New Mexico. They took 50 percent of the seats on the ballot. This was higher than the 40.77 percent of school board seats won by newcomers nationwide.
The following sections analyze competitiveness and incumbency advantage in New Mexico's school board elections. These districts did not utilize primary or runoff elections. Winners only had to receive a plurality, or relative majority, of votes to secure a seat. All of the school board elections held in the state in 2015 were nonpartisan.
Details of the data discussed here can be found in the table below.
Competitiveness
In 2015, an average of 2.05 candidates ran per seat up for election in New Mexico's largest school districts. An average of 1.72 candidates ran per seat in elections held in the largest school districts nationwide. The percentage of unopposed seats was also lower in New Mexico. A total of 30 percent of school board seats in the state were unopposed, compared to 35.97 percent across the United States.
Incumbency advantage
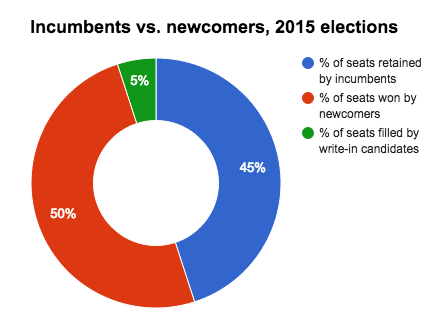
A total of 64.29 percent of incumbents who ran for re-election in New Mexico retained their seats in 2015. Fourteen of the 20 incumbents up for re-election ran to retain their seats, and nine of them won additional terms. Four of those winners ran unopposed and automatically won another term. The other five defeated challengers to keep their seats.
A total of 82.66 percent of incumbents kept their seats in school board elections across the country in 2015, and 40.45 percent of them ran unopposed. The map below details the success rates for incumbents who ran in the 2015 school board elections that were held in the largest school districts by enrollment in the U.S.
The map above details the success rates of incumbent who ran to retain their school board seats in the largest school districts in each state. States depicted in gray did not hold school board elections. |
Data table
The table below displays the statistics for school board elections in New Mexico's largest school districts in 2015.
| New Mexico school board elections, 2015 | ||||||||||
|---|---|---|---|---|---|---|---|---|---|---|
| Year | Total | Incumbents | ||||||||
| Seats up | Candidates | Candidates/ seat |
Unopposed seats | % unopposed | % seats won by newcomers | Sought re-election | Unopposed | Retained | % retained | |
| 2015 | 20 | 41 | 2.05 | 6 | 30.00% | 50.00% | 14 | 4 | 9 | 64.29% |
Spotlight districts
Superintendent searches and a collaborative charter school building project with a neighboring community college were some of the top issues facing New Mexico's largest school districts going into the 2015 elections.
Albuquerque Public Schools
In August 2014, Winston Brooks resigned as superintendent of Albuquerque Public Schools two years before his contract was supposed to end, after the school board bought out the remaining years. Records show Brooks had been involved in accusations of intimidation and retaliation and that a lawyer had been hired to look into the situation.[2][3]
Brad Winter, the district's former chief operations officer, was named as interim superintendent for the duration of the school board's search for a new permanent superintendent.[4]
Meanwhile, the district partnered with Central New Mexico Community College to build a new building on the community college's campus. The planned structure would house two of the district's charter schools, Native American Community Academy and the College and Career High School. The project was slated to open in time for the 2017-2018 school year.[5]
The plan for the new building could not move forward, however, until voters approved it. Both district and community college had to put the plan before the people in the form of bond measures in the 2016 bond elections, and both measures had to pass in order for the deal to continue.[5]
Farmington Municipal Schools
After working in education for nearly 54 years, Janel Ryan stepped down as superintendent of Farmington Municipal Schools. Ryan served as superintendent for 10 years before retiring in December 2014. Prior to taking on the role, Ryan had served as the district's personnel director and as assistant superintendent. She also previously worked as a teacher and an elementary school principal. Ryan announced her retirement in July 2014, after suffering from a heart attack.[6]
Phil Valdez, the district's former assistant superintendent for support services, was appointed to serve as interim superintendent. The district hired a consultant from Prather Consulting in October 2014 to help in the search for a new permanent superintendent.[7]
Survey responses
Four of the 42 candidates running for a school board seat in New Mexico's largest school districts in the 2015 elections responded to Ballotpedia's school board candidate survey. The following sections display their answers to questions about top priorities and education issues.
Top priorities

When asked what her top priority would be if elected, Analee Maestas, District 1 incumbent on the Albuquerque Board of Education stated:
| “ | Selection of the BEST superintendent. Develop critical partnerships to ensure schools are receiving every support needed to complete educational goals for every child. |
” |
| —Analee Maestas (2015)[9] | ||

Former District 2 incumbent on the Albuquerque Board of Education Kathy Korte said her top priorities would be:
| “ | To continue advocating for:
-- elimination of excessive high-stakes testing that unfairly grades teachers, schools and kids and the associated unfunded mandates from the state; |
” |
| —Kathy Korte (2015)[10] | ||

Maury Castro, who won the District 4 seat on the Las Cruces Board of Education, stated the following as his top priorities:
| “ | My top priority is do away with the current teacher evaluation criteria and to lower the over emphasis of testing on students so teachers can spend more time teaching.[8] | ” |
| —Maury Castro (2015)[11] | ||

Las Cruces District 5 winner Edward Frank responded with this statement:
| “ | We need a moratorium on the state mandated teacher evaluation system. The state system doesn't improve teaching and it erodes morale. What good is it?[8] | ” |
| —Edward Frank (2015)[12] | ||
Ranking the issues
The candidates were asked to rank the following issues by importance in the school district, with 1 being the most important and 7 being the least important. This table displays the candidates' average rankings as well as the highest and lowest rankings for each issue.
| Issue importance ranking | |||
|---|---|---|---|
| Issues | Average ranking | Highest ranking | Lowest ranking |
| Expanding arts education | 3.5 | 2 | 6 |
| Expanding career-technical education | 4.5 | 1 | 7 |
| Balancing or maintaining the district's budget | 3.5 | 2 | 4 |
| Improving college readiness | 4.25 | 2 | 7 |
| Closing the achievement gap | 2.25 | 1 | 6 |
| Improving education for special needs students | 4.75 | 3 | 6 |
| Expanding school choice options | 5.25 | 2 | 7 |
Positions on the issues
The candidates were asked an additional 10 short answer and multiple choice questions regarding significant issues in education. Links to those responses can be found below.
- Analee Maestas survey responses
- Kathy Korte survey responses
- Maury Castro survey responses
- Edward Frank survey responses
State profile
| Demographic data for New Mexico | ||
|---|---|---|
| New Mexico | U.S. | |
| Total population: | 2,080,328 | 316,515,021 |
| Land area (sq mi): | 121,298 | 3,531,905 |
| Race and ethnicity** | ||
| White: | 73.2% | 73.6% |
| Black/African American: | 2.1% | 12.6% |
| Asian: | 1.4% | 5.1% |
| Native American: | 9.1% | 0.8% |
| Pacific Islander: | 0.1% | 0.2% |
| Two or more: | 3.3% | 3% |
| Hispanic/Latino: | 47.4% | 17.1% |
| Education | ||
| High school graduation rate: | 84.2% | 86.7% |
| College graduation rate: | 26.3% | 29.8% |
| Income | ||
| Median household income: | $44,963 | $53,889 |
| Persons below poverty level: | 24.7% | 11.3% |
| Source: U.S. Census Bureau, "American Community Survey" (5-year estimates 2010-2015) Click here for more information on the 2020 census and here for more on its impact on the redistricting process in New Mexico. **Note: Percentages for race and ethnicity may add up to more than 100 percent because respondents may report more than one race and the Hispanic/Latino ethnicity may be selected in conjunction with any race. Read more about race and ethnicity in the census here. | ||
Presidential voting pattern
- See also: Presidential voting trends in New Mexico
New Mexico voted for the Democratic candidate in six out of the seven presidential elections between 2000 and 2024.
Pivot Counties (2016)
Ballotpedia identified 206 counties that voted for Donald Trump (R) in 2016 after voting for Barack Obama (D) in 2008 and 2012. Collectively, Trump won these Pivot Counties by more than 580,000 votes. Of these 206 counties, three are located in New Mexico, accounting for 1.46 percent of the total pivot counties.[13]
Pivot Counties (2020)
In 2020, Ballotpedia re-examined the 206 Pivot Counties to view their voting patterns following that year's presidential election. Ballotpedia defined those won by Trump won as Retained Pivot Counties and those won by Joe Biden (D) as Boomerang Pivot Counties. Nationwide, there were 181 Retained Pivot Counties and 25 Boomerang Pivot Counties. New Mexico had three Retained Pivot Counties, 1.66 percent of all Retained Pivot Counties.
More New Mexico coverage on Ballotpedia
- Elections in New Mexico
- United States congressional delegations from New Mexico
- Public policy in New Mexico
- Endorsers in New Mexico
- New Mexico fact checks
- More...
Academic performance
| Education terms |
|---|
| For more information on education policy terms, see this article. |
- See also: Public education in New Mexico
NAEP scores
- See also: NAEP scores by state
The National Center for Education Statistics provides state-by-state data on student achievement levels in mathematics and reading in the National Assessment of Educational Progress (NAEP). The chart below presents the percentage of fourth and eighth grade students that scored at or above proficient in reading and math during the 2012-2013 school year. Compared to three neighboring states (Arizona, Colorado, and Utah), New Mexico had the lowest percentage of students score at or above proficient in nearly every category.[14]
| Percent of students scoring at or above proficient, 2012-2013 | ||||
|---|---|---|---|---|
| Math - Grade 4 | Math - Grade 8 | Reading - Grade 4 | Reading - Grade 8 | |
| New Mexico | 31% | 23% | 21% | 22% |
| Arizona | 40% | 31% | 28% | 28% |
| Colorado | 50% | 42% | 41% | 40% |
| Utah | 44% | 36% | 37% | 39% |
| United States | 41% | 34% | 34% | 34% |
| Source: United States Department of Education, ED Data Express, "State Tables" | ||||
Graduation, ACT and SAT scores
The following table shows the graduation rates and average composite ACT and SAT scores for New Mexico and surrounding states during the 2012-2013 school year. All statements made in this section refer to that school year.[14][15][16]
In the United States, public schools reported graduation rates that averaged to about 81.4 percent. About 54 percent of all students in the country took the ACT, while 50 percent reported taking the SAT. The average national composite scores for those tests were 20.9 out of a possible 36 for the ACT and 1,498 out of a possible 2,400 for the SAT.[17]
New Mexico schools reported a graduation rate of 70.3 percent during the 2012-2013 school year, which was lowest among its neighboring states.
In New Mexico, more students took the ACT than the SAT in 2013, earning an average ACT score of 19.9.
| Comparison table for graduation rates and test scores, 2012-2013 | |||||||
|---|---|---|---|---|---|---|---|
| State | Graduation rate, 2013 | Average ACT composite, 2013 | Average SAT composite, 2013 | ||||
| Percent | Quintile ranking** | Score | Participation rate | Score | Participation rate | ||
| New Mexico | 70.3% | Fifth | 19.9 | 70% | 1,626 | 12% | |
| Arizona | 75.1% | Fifth | 19.6 | 50% | 1,551 | 35% | |
| Colorado | 76.9% | Fourth | 20.4 | 100% | 1,721 | 14% | |
| Utah | 83% | Third | 20.7 | 100% | 1,684 | 6% | |
| United States | 81.4% | 20.9 | 54% | 1498 | 50% | ||
| **Graduation rates for states in the first quintile ranked in the top 20 percent nationally. Similarly, graduation rates for states in the fifth quintile ranked in the bottom 20 percent nationally. Sources: United States Department of Education, "ED Data Express" ACT.org, "2013 ACT National and State Scores" The Commonwealth Foundation, "SAT scores by state, 2013" | |||||||
Dropout rate
- See also: Public high school dropout rates by state for a full comparison of dropout rates by group in all states
The high school event dropout rate indicates the proportion of students who were enrolled at some time during the school year and were expected to be enrolled in grades nine through 12 in the following school year but were not enrolled by October 1 of the following school year. Students who have graduated, transferred to another school, died, moved to another country, or who are out of school due to illness are not considered dropouts. The average public high school event dropout rate for the United States remained constant at 3.3 percent for both school year 2010–2011 and school year 2011–2012. The event dropout rate for New Mexico was higher than the national average at 5.0 percent in the 2010-2011 school year, and 5.9 percent in the 2011-2012 school year.[18]
See also


Footnotes
- ↑ National Center for Education Statistics, "Elementary/Secondary Information System," accessed April 20, 2015
- ↑ KOB 4, "Search for superintendent triggers community survey," January 6, 2015
- ↑ Albuquerque Journal, "Former Wichita school superintendent Winston Brooks gets $350,000 buyout in Albuquerque," August 19, 2014
- ↑ KOAT7 7, "Interim APS superintendent unveils 5-year plan," December 31, 2014
- ↑ 5.0 5.1 Albuquerque Journal, "APS, CNM plan to build site for 2 charters on college campus," January 2, 2015
- ↑ Daily Times, "Farmington Municipal School District Superintendent Janel Ryan retires after 54 years in education," December 15, 2014
- ↑ Daily Times, "Farmington Municipal School District hires consultant to help in superintendent search," October 30, 2014
- ↑ 8.0 8.1 8.2 8.3 Note: This text is quoted verbatim from the original source. Any inconsistencies are attributable to the original source.
- ↑ Ballotpedia School Board Candidate Survey, 2015, "Analee Maestas responses," January 23, 2015
- ↑ Ballotpedia School Board Candidate Survey, 2015, "Kathy Korte responses," January 16, 2015
- ↑ Ballotpedia School Board Candidate Survey, 2015, "Maury Castro responses," January 10, 2015
- ↑ Ballotpedia School Board Candidate Survey, 2015, "Edward Frank responses," January 14, 2015
- ↑ The raw data for this study was provided by Dave Leip of Atlas of U.S. Presidential Elections.
- ↑ 14.0 14.1 United States Department of Education, ED Data Express, "State Tables," accessed May 13, 2014
- ↑ ACT, "2012 ACT National and State Scores," accessed May 13, 2014
- ↑ Commonwealth Foundation, "SAT Scores by State 2013," October 10, 2013
- ↑ StudyPoints, "What's a good SAT score or ACT score?" accessed June 7, 2015
- ↑ United States Department of Education, National Center for Education Statistics, "Common Core of Data (CCD), State Dropout and Graduation Rate Data File, School Year 2010-11, Provision Version 1a and School Year 2011-12, Preliminary Version 1a," accessed May 13, 2014
| |||||