|
1.
Capital Asset Pricing Model (CAPM)
- allows investors to determine a return on a project given a project's risk, market return, and a risk free investment
- Estimate returns on risky assets
- Prices adjust to supply and demand
- Uses indexing
- Indexing - holding a portfolio in the same proportions as a market index
- S&P 500
- Calculate risk premium on securities
-
Optimal Portfolio
is to hold a combination of risky securities as the market portfolio
-
Capital Market Line (CML)

- Point F - risk free asset
- Point M - market portfolio
- In equilibrium, CML represents the best risk-reward combination for all investors
- Notation
- Expected return on project is E(r)
- Return for risk-free security is r f
- Expected return on portfolio m is E(r m)
- Standard deviation for portfolio m is s
m
- Standard deviation is s
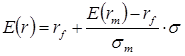
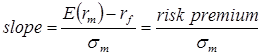
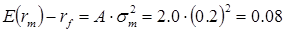
- In CAPM, the equilibrium risk premium is:

-
A is the degree of risk aversion
- Example

- b is the marginal contribution of a security's return to the standard deviation of a market's return

where
s
jm=cov(security j, market portfolio)
The security market line is graphed as:


- If b
j > 1, security's return is greater than market
- If b
j<1, security has an average risk
- Benefits
- CAPM has performed better than actively managed portfolios
- Cost less to implement than researching for an active portfolio
Example 1: If market return is 10%, a comparable U.S. government security is 4%, and b = 0.5, what return should the investment or project have?

If a project with a b = 0.5 has a return of at least 7%, then proceed with the project. What if everything was the same except b = 2?

You can include the rate of return into a project's net present value of cash flows. If the net present value is positive, then proceed with the project
Corporate Project
- Pays $100,000 on first day of project
- Company receives cash flow
- Year 1 $45,000
- Year 2 $50,000
- Year 3 $55,000
- At end of Year 3, company sells building for $50,000
- Company has a b = 2.0

Valuation of a Stock Price
- g is the growth rate in dividends
- k is the risk-adjusted discount rate
- D j is the stock dividend

- Using CAPM
- r f = 0.04
-
b
steady = 1.5
- Risk premium is 0.08


|
Expect the equity premium to be 1% to 8%. Any out of this range may be unrealistic. |
|
|
Problems with CAPM
- True betas are unknown
- True expected cash flows from a project are unknown
- True expected returns from investments are unknown
- Historical data
- How far back should the data go
- 3 years or 100 years
- World changes; should focus on recent data
- What about the impact of financial bubbles (or stock market crashes)
- Dot-com crash of 2001
- Stock market crash in 1987
- These impact parameters if included
- Predict stock market returns on forecasting dividends
- Higher dividends should result in higher dividends
- Problem - Stock market performed well when dividends were close to zero
- Equity premium
- Historical - stock market earn 3% more than bondholders
- Problem - Use Rule 72
- If the interest rate is 3%, then 72 divided by 3 is 24
- At a 3% interest rate, your money doubles in 24 years
- Problem - why is the purpose of investing in bonds
- Survey of Experts
- Problem - Experts can be wrong
- Example - Recessions - do not ask an economists; economists are the worse at predicting recessions
- CAPM does not distinguish between companies that have low debt or high debts
- If you estimated a CAPM for a corporation
- The corporation issues large amounts of bonds and uses it to buy back stock
- As an investor, the higher debt is worrisome, but CAPM does not reflect it
- Beta tends to be small for large companies and large for small companies
- Some companies may be a good investment
- Beta tends to be high for high-tech industries and low for traditional industries
- Some high-tech investments were good like Microsoft
|
|
Despite problems with the CAPM, 73% of executives use it to evaluate future projects. |
|
|
Example 2: If market return is 8%, a comparable U.S. government security is 4%, and b = 1.0, what return should the investment or project have?

What if you believe the inflation rate is 2%, then add this to the project's rate or return, yielding 10%.
What if the following events occur in one year when you invest $10,000?
| Outcome |
Outcome (x) |
Probability (p) |
Expected
Return |
| Project payout |
$10,000 (1 + r) |
0.9 |
??? |
| Gov. seizes assets |
$0 |
0.1 |
0% |
This project needs to earn at least:

Using the payout matrix, the project needs a return of:
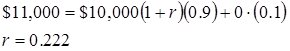
- Total rate or return for project = 22.2%
- Risk premium = 4%
- Includes the impact of beta
- Risk free rate of return = 4%
- Inflation premium = 2%
- Risk of government seizure = 12.2%
|