Michigan gubernatorial and lieutenant gubernatorial election, 2014
 |
August 5, 2014 |
November 4, 2014 |
Rick Snyder Brian Calley |
Rick Snyder Brian Calley |
Governor • Lieutenant Governor Secretary of State • Attorney General |
 |

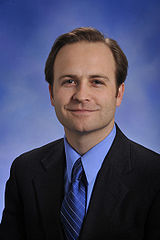
The Michigan gubernatorial and lieutenant gubernatorial election took place on November 4, 2014. Incumbents Rick Snyder (R) and Brian Calley (R) ran for re-election. Snyder and Calley won concurrent four-year terms in office.
A primary election is an election in which registered voters select a candidate that they believe should be a political party's candidate for elected office to run in the general election. They are also used to choose convention delegates and party leaders. Primaries are state-level and local-level elections that take place prior to a general election. Michigan utilizes an open primary system, in which registered voters do not have to be members of a party to vote in that party's primary.[1]<[2] The attorney general and secretary of state did not appear on the primary ballot, and the gubernatorial and lieutenant gubernatorial positions did not have contested primaries in 2014.[3]
Snyder and his Democratic opponent, Mark Schauer, were engaged in a close race to the governor's mansion. Learn more about polling trends by checking out the polls section. Gubernatorial races in Michigan had experienced growing margins of victory since 2002, as shown by the margin of victory analysis chart linked here. You can also learn more about the campaign's television ads by checking out the campaign media section.
The gubernatorial race was not the only race on the November ballot that had the potential to shift the balance of power in Michigan. The Michigan House of Representatives was identified by Ballotpedia as one of the top 20 legislative chambers to watch in 2014. Heading into the election, both legislative chambers and the governor's office were held by a single party, making Michigan a state government trifecta. Learn more about the chamber's most competitive races on the battleground chambers page.
Candidates
General election
Rick Snyder/Brian Calley - Incumbents
Mark Schauer/Lisa Brown[4][5]
Mary Buzuma/Scott Boman
U.S. Taxpayers Party candidates Mark McFarlin/Richard Mendoza
Paul Homeniuk/Candace R. Caveny
Did not qualify
Declined potentials
Virg Bernero - 2010 Democratic nominee for Governor of Michigan[5][7]
Gary Peters - U.S. Representative, Michigan, District 14[5]
Results
General election
| Governor and Lieutenant Governor of Michigan, 2014 | ||||
|---|---|---|---|---|
| Party | Candidate | Vote % | Votes | |
| Republican | 50.9% | 1,607,399 | ||
| Democratic | Mark Schauer/Lisa Brown | 46.9% | 1,479,057 | |
| Libertarian | Mary Buzuma/Scott Boman | 1.1% | 35,723 | |
| U.S. Taxpayers | Mark McFarlin/Richard Mendoza | 0.6% | 19,368 | |
| Green | Paul Homeniuk/Candace R. Caveny | 0.5% | 14,934 | |
| Nonpartisan | Write-in votes | 0% | 50 | |
| Total Votes | 3,156,531 | |||
| Election results via Michigan Department of State | ||||
Race background
First-term Republican Gov. Rick Snyder won re-election in 2014.[8] In December 2012, in the wake of the passage of a right-to-work law that provoked protests, particularly from unions, a Public Policy Poll showed dwindling chances for the governor to win another term compared to a similar poll released the previous month. His approval decreased by 28 points, with respondents preferring each of the poll's four hypothetical Democratic challengers over Snyder for 2014.[9][10]
At a Republican leadership conference in September 2011, Snyder told an interviewer that if he felt satisfied with the legacy he established during his first term, he would be inclined to pass the torch to others, indicating that a 2014 re-election bid was not guaranteed to happen. He went on to say that, should he decline to run for a second term, he would be "happy to go fishing, go teach or do something else," rather than seek a new political office.[11]
In late September 2013, Snyder began airing commercials talking about his successes in office. While the governor suggested they were not campaign commercials, they were widely seen as a way to boost Snyder before the 2014 campaign got underway.[12][13] Around that time, Snyder was publicly targeted for defeat in 2014 by the AFL-CIO.
The general election race took shape following August party conventions that saw Snyder and Democratic candidate Mark Schauer win their party nominations. Early polling for the general election revealed a close race, with a Mitchell Research survey showing a five-point lead for Snyder when all candidates were available to respondents. Head-to-head polling grew closer after August 2014, with Schauer and Snyder narrowly winning polls from EPIC-MRA and Detroit News-WDIV, respectively. A We Ask America poll in late September showed a tie race between Schauer and Snyder, with 10 percent of voters undecided.[14]
Endorsements
Former New York City mayor Michael Bloomberg endorsed Rick Snyder ahead of the general election. Bloomberg coupled the endorsement with $2.3 million in TV ad purchases on behalf of Snyder, citing the governor's independent-mindedness as a reason for the support. The former mayor also endorsed Democratic candidate Gary Peters in the U.S. Senate race.[15]
Convention challenge for Calley
Lt. Gov. Brian Calley faced a challenge from Wes Nakagiri in the August 23 state Republican convention, and received enough precinct delegates to hold off the challenge. Gov. Rick Snyder announced his desire to see Calley join him on the ticket, but party rules dictated that the convention's delegates select nominees rather than the general public. Eleven employees from the governor's and lieutenant governor's offices sought delegate seats in the primary. There was also an influx of money from the Michigan Advocacy Trust, which distributed mailers supporting pro-Calley candidates in Clinton County[16] Calley defeated Nakagiri during the convention, with reports noting that the lieutenant governor received at least 60 percent of delegate votes.[17]
Debates
October 13 debate
Rick Snyder (R) and Mark Schauer (D) clashed over Detroit's bankruptcy proceedings, education spending and same-sex marriage during a debate at Wayne State University. Snyder argued on behalf of the state emergency manager's decision to take Detroit into bankruptcy, noting that the city was only months away from shedding $9 billion in debts. Schauer countered that pensioners in the city should not have been asked to cut their plans, citing legal and constitutional protections for public pension plans.[18]
Schauer criticized the governor's tax reform plan implemented in 2011, which he claimed cut $1 billion in education funds, raised taxes on the middle class by $1.4 billion and cut taxes for high-income earners by $1.8 billion. Snyder defended his tax plans by noting that education spending was up $1 billion during his term in office and tax reform brought fairer rates to small business owners.[18]
Snyder, who opposed same-sex marriage during his 2010 campaign, stated that he would abide by a federal appeals court ruling regarding Michigan's ban on the practice. Schauer criticized Snyder for what he claimed was evading a question about his stance on same-sex marriage and supporting a law that banned benefits for the partners of state employees.[18]
Polls
All candidates
| Governor of Michigan - All candidates | |||||||||||||||||||
|---|---|---|---|---|---|---|---|---|---|---|---|---|---|---|---|---|---|---|---|
| Poll | Rick Snyder* (R) | Mark Schauer (D) | Mary Buzuma (L) | Mark McFarlin (UST) | Paul Homeniuk (G) | Undecided | Margin of error | Sample size | |||||||||||
| Public Policy Polling (November 1-2, 2014) | 46% | 45% | 3% | 0% | 1% | 5% | +/-- | 914 | |||||||||||
| Mitchell Research (October 27, 2014) | 48% | 43% | 2% | 1% | 0.4% | 5% | +/-2.88 | 1,159 | |||||||||||
| Mitchell Research (October 19, 2014) | 48% | 45.7% | 1% | 1.4% | 1% | 2.9% | +/-3.23 | 919 | |||||||||||
| Fox 2 Detroit/Mitchell Research (October 9, 2014) | 47% | 46% | 1% | 1% | 2% | 3% | +/-2.71 | 1,306 | |||||||||||
| The Detroit News/WDIV (October 2-4, 2014) | 44.9% | 37.1% | 1.7% | 0.5% | 1.2% | 14.7% | +/-4 | 600 | |||||||||||
| Mitchell Research (September 29, 2014) | 46% | 42% | 2% | 1% | 1% | 8% | +/-2.86 | 1,178 | |||||||||||
| We Ask America (September 18-19, 2014) | 43% | 43% | 2% | 1% | 1% | 10% | +/-3 | 1,182 | |||||||||||
| Mitchell Research (September 14, 2014) | 46% | 41% | 4% | 2% | 1% | 6% | +/-3.4 | 829 | |||||||||||
| Public Policy Polling (September 4-7, 2014) | 43% | 42% | 3% | 2% | 1% | 9% | +/-3.7 | 687 | |||||||||||
| AVERAGES | 45.77% | 42.76% | 2.19% | 1.1% | 1.07% | 7.07% | +/-2.86 | 974.89 | |||||||||||
| Note: The polls above may not reflect all polls that have been conducted in this race. Those displayed are a random sampling chosen by Ballotpedia staff. If you would like to nominate another poll for inclusion in the table, send an email to editor@ballotpedia.org. | |||||||||||||||||||
Major party candidates
| Governor of Michigan - Major party candidates- October 2014 | |||||||||||||||||||
|---|---|---|---|---|---|---|---|---|---|---|---|---|---|---|---|---|---|---|---|
| Poll | Rick Snyder* (R) | Mark Schauer (D) | Third Party/Undecided | Margin of error | Sample size | ||||||||||||||
| EPIC-MRA (October 26-28, 2014) | 45% | 43% | 12% | +/-4 | 600 | ||||||||||||||
| New York Times/CBS News/YouGov (October 16-23, 2014) | 44% | 45% | 12% | +/-3 | 2,394 | ||||||||||||||
| Public Policy Polling (October 20-21, 2014) | 48% | 48% | 4% | +/-3.6 | 723 | ||||||||||||||
| EPIC-MRA (October 17-19, 2014) | 47% | 39% | 14% | +/-4 | 600 | ||||||||||||||
| Public Policy Polling (October 2-3, 2014) | 47% | 46% | 7% | +/-3 | 654 | ||||||||||||||
| MRG Poll (September 30-October 1, 2014) | 45.7% | 40.5% | 13.9% | +/-4 | 600 | ||||||||||||||
| AVERAGES | 46.12% | 43.58% | 10.48% | +/-3.6 | 928.5 | ||||||||||||||
| Note: The polls above may not reflect all polls that have been conducted in this race. Those displayed are a random sampling chosen by Ballotpedia staff. If you would like to nominate another poll for inclusion in the table, send an email to editor@ballotpedia.org. | |||||||||||||||||||
| Governor of Michigan - Major party candidates through September 2014 | |||||||||||||||||||
|---|---|---|---|---|---|---|---|---|---|---|---|---|---|---|---|---|---|---|---|
| Poll | Rick Snyder* (R) | Mark Schauer (D) | Third Party/Undecided | Margin of error | Sample size | ||||||||||||||
| Lake Research Partners (September 26-30, 2014) | 44% | 43% | 12% | +/-4 | 600 | ||||||||||||||
| EPIC-MRA (September 25-29, 2014) | 45% | 39% | 16% | +/-4 | 600 | ||||||||||||||
| Target Insyght (September 22-24, 2014) | 41% | 40% | 19% | +/-4 | 600 | ||||||||||||||
| Rasmussen Reports (September 17-18, 2014) | 47% | 41% | 12% | +/-4 | 750 | ||||||||||||||
| Detroit News-WDIV (September 3-5, 2014) | 43.6% | 41.8% | 14.5% | +/-4 | 600 | ||||||||||||||
| EPIC-MRA (August 22-25, 2014) | 43% | 45% | 12% | +/-4 | 600 | ||||||||||||||
| Mitchell Research and Communications (June 6, 2014) | 46% | 41% | 13% | +/-3.16 | 961 | ||||||||||||||
| Mitchell Research & Communications (April 9, 2014) | 49% | 37% | 15% | +/-2.56 | 1,460 | ||||||||||||||
| Lambert, Edwards & Associates (dead link) (March 14, 2014) | 42% | 39% | 19% | +/-4.0 | 600 | ||||||||||||||
| EPIC-MRA (February 5-11, 2014) | 47% | 39% | 14% | +/-4.0 | 600 | ||||||||||||||
| Conservative Intel Poll (January 7-8, 2014) | 47% | 35% | 18% | +/-3.83 | 1,004 | ||||||||||||||
| Public Policy Poll (December 5-8, 2013) | 44% | 40% | 16% | +/-3.0 | 1,034 | ||||||||||||||
| EPIC-MRA (September 2013) | 44% | 36% | 20% | +/-4 | 600 | ||||||||||||||
| EPIC-MRA (May 2013) | 38% | 39% | 23% | +/-4 | 600 | ||||||||||||||
| AVERAGES | 44.33% | 39.7% | 15.96% | +/-3.75 | 757.79 | ||||||||||||||
| Note: The polls above may not reflect all polls that have been conducted in this race. Those displayed are a random sampling chosen by Ballotpedia staff. If you would like to nominate another poll for inclusion in the table, send an email to editor@ballotpedia.org. | |||||||||||||||||||
- An asterisk denotes incumbent status.
Campaign media
Mark Schauer
|
|
|
Rick Snyder
|
|
|
|
|
|
|
Outside groups
Democratic Governors Association
|
|
|
|
|
|
|
|
|
|
|
|
Republican Governors Association
|
|
|
|
|
|
|
|
|
|
|
Michigan Nurses Association
|
Ad spending
The Wesleyan Media Project published a report on September 30, 2014, highlighting spending on gubernatorial races from September 12-25. This report found that Democratic and Republican groups spent a total of $46.84 million on TV ads in 15 states with gubernatorial elections. The following chart details the group's findings, including spending amounts and number of ads:[19]
Note: A bolded number indicates the highest total for this category. A number in italics is the lowest total for this category.
| Spending on TV ads, September 12-25, 2014 | |||||
|---|---|---|---|---|---|
| State | Total # of ads | % Democratic-leaning ads | % GOP-leaning ads | Total spending-Democratic leaning (in millions of $) | Total spending-GOP leaning (in millions of $) |
| Colorado | 2,460 | 83.1 | 16.9 | 1.35 | 0.39 |
| Connecticut | 2,312 | 61.7 | 38.3 | 1.48 | 0.89 |
| Florida | 20,111 | 38.5 | 61.5 | 4.07 | 6.64 |
| Georgia | 4,625 | 51.1 | 48.9 | 1.43 | 0.99 |
| Illinois | 7,793 | 63.5 | 36.5 | 4.17 | 3.5 |
| Iowa | 2,134 | 47.5 | 52.5 | 0.25 | 0.38 |
| Kansas | 5,024 | 45.7 | 54.3 | 0.85 | 1.17 |
| Maine | 3,281 | 42.3 | 57.7 | 0.46 | 0.32 |
| Michigan | 6,767 | 33.9 | 66.1 | 1.14 | 2.3 |
| Minnesota | 1,974 | 83.9 | 16.1 | 0.65 | 0.29 |
| New York | 4,926 | 61 | 39 | 2.18 | 0.88 |
| Pennsylvania | 3,263 | 50.9 | 49.1 | 1.58 | 1.23 |
| South Carolina | 2,883 | 39.1 | 60.9 | 0.33 | 0.38 |
| Texas | 10,330 | 33.4 | 66.6 | 2.24 | 2.93 |
| Wisconsin | 7,374 | 63.3 | 36.7 | 1.36 | 1.01 |
| TOTALS | 85,257 | 48.2 | 51.8 | 23.54 | 23.3 |
Past elections
Margin of victory analysis
The average margin of victory in the past three races for governor was 12.1 percent. The smallest margin of victory was 4 percent in 2002, while the largest margin of victory was 18.2 percent in 2010. Percentages of votes for third-party candidates have increased from 1.2 percent in 2002 to 1.9 percent in 2010. The following chart compares the margin of victory for winners of gubernatorial races with the margin of victory for candidates who won the most votes for the top race on the ballot:[20]
| Margin of victory analysis | ||||||
|---|---|---|---|---|---|---|
| Year | Gov. candidate margin of victory (%) | Party of winning candidate | Top race on ballot | Party of winning candidate | Margin of victory (%) | |
| 2010 | 18.2 | - | - | - | ||
| 2006 | 14.1 | U.S. Senate | 15.6 | |||
| 2002 | 4 | U.S. Senate | 22.7 | |||
Note: There was no statewide vote for federal office in 2010.
2010
- See also: Michigan gubernatorial election, 2010
| Governor of Michigan, 2010 | ||||
|---|---|---|---|---|
| Party | Candidate | Vote % | Votes | |
| Republican | 58.1% | 1,874,834 | ||
| Democratic | Virg Bernero | 39.9% | 1,287,320 | |
| Green | Harley Mikkelson | 0.6% | 20,699 | |
| U.S. Taxpayers | Stacey Mathia | 0.6% | 20,818 | |
| Libertarian | Ken Proctor | 0.7% | 22,390 | |
| Write-in | Write-in candidates | 0% | 27 | |
| Total Votes | 3,226,088 | |||
2006
| Governor of Michigan, 2006 | ||||
|---|---|---|---|---|
| Party | Candidate | Vote % | Votes | |
| Democratic | 56.4% | 2,142,513 | ||
| Republican | Dick DeVos | 42.3% | 1,608,086 | |
| Libertarian | Gregory Creswell | 0.6% | 23,524 | |
| Green | Douglas Campbell | 0.5% | 20,009 | |
| U.S. Taxpayers | Bhagwan Dashairya | 0.2% | 7,087 | |
| Write-in | Write-in candidates | 0% | 37 | |
| Total Votes | 3,801,256 | |||
2002
| Governor of Michigan, 2002 | ||||
|---|---|---|---|---|
| Party | Candidate | Vote % | Votes | |
| Democratic | 51.4% | 1,633,796 | ||
| Republican | Dick Posthumus | 47.4% | 1,506,104 | |
| Green | Douglas Campbell | 0.8% | 25,236 | |
| U.S. Taxpayers | Joseph Pilchak | 0.4% | 12,411 | |
| Write-in | Write-in candidates | 0% | 18 | |
| Total Votes | 3,177,565 | |||
Voter turnout
Political scientist Michael McDonald's United States Elections Project studied voter turnout in the 2014 election by looking at the percentage of eligible voters who headed to the polls. McDonald used voting-eligible population (VEP), or the number of eligible voters independent of their current registration status, to calculate turnout rates in each state on November 4. He also incorporated ballots cast for the highest office in each state into his calculation. He estimated that 81,687,059 ballots were cast in the 50 states plus the District of Columbia, representing 35.9 percent of the VEP.[21] By comparison, 61.6 percent of VEP voted in the 2008 presidential election and 58.2 percent of VEP voted in the 2012 presidential election.[22]
Quick facts
- According to PBS Newshour, voter turnout in the 2014 midterms was the lowest since the 1942 midterms, which took place during the nation's involvement in World War II.[23]
- Forty-three states and the District of Columbia failed to surpass 50 percent turnout in McDonald's analysis.
- The three states with the lowest turnout according to McDonald's analysis were Texas (28.3 percent), Tennessee (28.6 percent), and Indiana (28.8 percent).
- Maine (58.5 percent), Wisconsin (56.5 percent), and Colorado (54.5 percent) were the three states with the highest turnout.
- There were only 12 states that increased voter turnout in 2014 compared to the 2010 midterm elections.[24]
| Voter turnout rates, 2014 | |||||
|---|---|---|---|---|---|
| State | Total votes counted | % voter eligible population | Top statewide office up for election | Size of lead (Raw votes) | Size of lead (%) |
| Alabama | 1,191,274 | 33.2 | Governor | 320,319 | 27.2 |
| Alaska | 285,431 | 54.4 | Governor | 4,004 | 1.6 |
| Arizona | 1,537,671 | 34.1 | Governor | 143,951 | 12.5 |
| Arkansas | 852,642 | 40.1 | Governor | 118,664 | 14.0 |
| California | 7,513,972 | 30.8 | Governor | 1,065,748 | 17.8 |
| Colorado | 2,080,071 | 54.5 | Governor | 50,395 | 2.4 |
| Connecticut | 1,096,509 | 42.5 | Governor | 26,603 | 2.5 |
| Delaware | 234,038 | 34.4 | Attorney General | 31,155 | 13.6 |
| District of Columbia | 177,176 | 35.8 | Mayor | 27,934 | 19.0 |
| Florida | 6,026,802 | 43.3 | Governor | 66,127 | 1.1 |
| Georgia | 2,596,947 | 38.5 | Governor | 202,685 | 8.0 |
| Hawaii | 369,554 | 36.5 | Governor | 45,323 | 12.4 |
| Idaho | 445,307 | 39.6 | Governor | 65,852 | 14.9 |
| Illinois | 3,680,417 | 40.9 | Governor | 171,900 | 4.9 |
| Indiana | 1,387,622 | 28.8 | Secretary of State | 234,978 | 17.8 |
| Iowa | 1,142,284 | 50.2 | Governor | 245,548 | 21.8 |
| Kansas | 887,023 | 43.4 | Governor | 33,052 | 3.9 |
| Kentucky | 1,435,868 | 44.0 | U.S. Senate | 222,096 | 15.5 |
| Louisiana | 1,472,039 | 43.8 | U.S. Senate | 16,401 | 1.1 |
| Maine | 616,996 | 58.5 | Governor | 29,820 | 4.9 |
| Maryland | 1,733,177 | 41.5 | Governor | 88,648 | 6.1 |
| Massachusetts | 2,186,789 | 44.6 | Governor | 40,361 | 1.9 |
| Michigan | 3,188,956 | 43.2 | Governor | 129,547 | 4.3 |
| Minnesota | 1,992,613 | 50.5 | Governor | 109,776 | 5.6 |
| Mississippi | 631,858 | 28.9 | U.S. Senate | 141,234 | 33.0 |
| Missouri | 1,426,303 | 31.8 | Auditor | 684,074 | 53.6 |
| Montana | 373,831 | 47.3 | U.S. Senate | 65,262 | 17.9 |
| Nebraska | 552,115 | 41.5 | Governor | 97,678 | 18.7 |
| Nevada | 547,349 | 29.0 | Governor | 255,793 | 46.7 |
| New Hampshire | 495,565 | 48.4 | Governor | 24,924 | 5.2 |
| New Jersey | 1,955,042 | 32.5 | N/A | N/A | N/A |
| New Mexico | 512,805 | 35.7 | Governor | 73,868 | 14.6 |
| New York | 3,930,310 | 29.0 | Governor | 476,252 | 13.4 |
| North Carolina | 2,939,767 | 41.2 | U.S. Senate | 48,511 | 1.7 |
| North Dakota | 255,128 | 45.0 | U.S. House At-large seat | 42,214 | 17.1 |
| Ohio | 3,149,876 | 36.2 | Governor | 933,235 | 30.9 |
| Oklahoma | 824,831 | 29.8 | Governor | 122,060 | 14.7 |
| Oregon | 1,541,782 | 53.5 | Governor | 59,029 | 4.5 |
| Pennsylvania | 3,495,866 | 36.0 | Governor | 339,261 | 9.8 |
| Rhode Island | 329,212 | 42.2 | Governor | 14,346 | 4.5 |
| South Carolina | 1,261,611 | 35.2 | Governor | 179,089 | 14.6 |
| South Dakota | 282,291 | 44.9 | Governor | 124,865 | 45.1 |
| Tennessee | 1,374,065 | 28.6 | Governor | 642,214 | 47.5 |
| Texas | 4,727,208 | 28.3 | Governor | 957,973 | 20.4 |
| Utah | 577,973 | 30.2 | Attorney General | 173,819 | 35.2 |
| Vermont | 193,087 | 38.8 | Governor | 2,095 | 1.1 |
| Virginia | 2,194,346 | 36.6 | U.S. Senate | 16,727 | 0.8 |
| Washington | 2,123,901 | 43.1 | N/A | N/A | N/A |
| West Virginia | 451,498 | 31.2 | U.S. Senate | 124,667 | 27.6 |
| Wisconsin | 2,410,314 | 56.5 | Governor | 137,607 | 5.7 |
| Wyoming | 168,390 | 39.3 | Governor | 52,703 | 33.6 |
Note: Information from the United States Elections Project was last updated on December 16, 2014.
Campaign finance
Comprehensive donor information for this election has been collected by Follow the Money. Based on available campaign finance records, the candidates raised a total of $19,824,474 during the election. This information was last updated on May 14, 2015.[25]
| Campaign Contribution Totals | ||||
|---|---|---|---|---|
| Candidate | Office | Result | Contributions | |
| Rick Snyder/Brian Calley |
Michigan Governor/Lieutenant Governor | $12,625,208 | ||
| Mark Schauer/Lisa Brown |
Michigan Governor/Lieutenant Governor | $7,193,253 | ||
| Mary Buzuma/Scotty Boman |
Michigan Governor/Lieutenant Governor | $4,295 | ||
| Paul Homeniuk/Candace Caveny |
Michigan Governor/Lieutenant Governor | $1,539 | ||
| Mark McFarlin/Richard Mendoza |
Michigan Governor/Lieutenant Governor | $179 | ||
| Grand Total Raised | $19,824,474 | |||
Key deadlines
| Deadline | Event |
|---|---|
| April 22, 2014 | Filing deadline for political party candidates |
| July 7, 2014 | Filing deadline for minor party candidates |
| August 5, 2014 | Primary election |
| November 4, 2014 | General election |
| January 1, 2015 | Inauguration day for state executive officials elected in November |
Recent news
This section links to a Google news search for the term "Michigan + governor + election"
See also
- Governor of Michigan
- Lieutenant Governor of Michigan
- Michigan state executive official elections, 2014
- State executive official elections, 2014
- State executive debates, 2014
External links
- Office of the Governor of Michigan
- Michigan Lieutenant Governor
- U.S. Taxpayers Party of Michigan announces 2014 candidates
- Michigan Green Party candidates
- Michigan Libertarians nominate candidates at state convention
Footnotes
- ↑ NCSL,"State Primary Election Types," accessed October 7, 2024
- ↑ Michigan.gov,"Questions and Answers: Michigan’s Presidential Primary," accessed October 7, 2024
- ↑ Michigan Secretary of State, "Filing Requirements for Secretary of State and Attorney General: 2014 Election Cycle," accessed August 5, 2014
- ↑ Mark Schaur for Governor Campaign Website, "Home," accessed May 29, 2013
- ↑ 5.0 5.1 5.2 Public Policy Polling, "Snyder's popularity plummets," December 18, 2012
- ↑ Ann Arbor, "Ann Arbor man looks to wage Independent campaign for governor of Michigan," May 30, 2013
- ↑ MLive.com, "Lansing Mayor Virg Bernero won't run for governor, Senate or Congress in 2014," March 20, 2013
- ↑ Governing, Michigan Governor Announces Re-election Bid, Despite Controversies, February 4, 2014
- ↑ Public Policy Polling, "Snyder's popularity plummets," December 18, 2012
- ↑ Public Policy Polling, "An early look at the 2014 governor landscape," November 12, 2012
- ↑ MLive, "Gov. Rick Snyder says he might not run for re-election in 2014 -- could Brian Calley or Bill Schuette succeed him?" September 25, 2011
- ↑ MLive, "Tim Skubick: Gov. Snyder's ads cleverly make a pre-emptive strike," September 29, 2013
- ↑ Huffington Post, "Rick Snyder Hopes To Be 'Reasonable Model' For GOP," September 22, 2013
- ↑ MLive, "AFL-CIO to target Michigan Gov. Rick Snyder, other Republican governors in 2014 election cycle," August 13, 2013
- ↑ The Detroit News, "Bloomberg endorses Snyder, Peters," October 7, 2014
- ↑ MLive.com, "Michigan 2014 Primary: Snyder staffers run for precinct posts with Calley nomination on the line," August 4, 2014
- ↑ Detroit Free Press, "GOP chooses Calley over Nakagiri for lieutenant governor," August 23, 2014
- ↑ 18.0 18.1 18.2 The Monitor, "Michigan's only gubernatorial debate grows testy," October 13, 2014
- ↑ Wesleyan Media Project, "GOP Groups Keeping Senate Contests Close," September 30, 2014
- ↑ Michigan Secretary of State, "Previous Election Information," accessed September 19, 2014
- ↑ United States Elections Project, "2014 November General Election Turnout Rates," November 7, 2014
- ↑ TIME, "Voter Turnout in Midterm Elections Hits 72-Year Low," November 10, 2014
- ↑ PBS, "2014 midterm election turnout lowest in 70 years," November 10, 2014
- ↑ U.S. News & World Report, "Midterm Turnout Down in 2014," November 5, 2014
- ↑ Follow the Money, "Overview of Michigan 2014 elections," accessed May 14, 2015
 |
State of Michigan Lansing (capital) |
|---|---|
| Elections |
What's on my ballot? | Elections in 2025 | How to vote | How to run for office | Ballot measures |
| Government |
Who represents me? | U.S. President | U.S. Congress | Federal courts | State executives | State legislature | State and local courts | Counties | Cities | School districts | Public policy |