Iowa state legislative special elections, 2018
- General election: Nov. 6
- Voter registration deadline: Oct. 27
- Early voting: Oct. 8 - Nov. 5
- Absentee voting deadline: Nov. 6
- Online registration: Yes
- Same-day registration: Yes
- Voter ID: ID required
- Poll times: 7:00 a.m. to 9:00 p.m.
2019 →
← 2017
|
special elections |
|
|
| Other election coverage |
State legislative elections State executive elections State judicial elections Ballot measures |
In 2018, two special elections were called to fill a vacant seat in the Iowa General Assembly. Click here to read more about the special election.
Senate special elections called:
- District 25: April 10
House special elections called:
- District 6: January 16
How vacancies are filled in Iowa
If there is a vacancy in the Iowa General Assembly, the vacant seat must be filled by a special election. The governor of Iowa is required within five days of a vacancy in the General Assembly to call for a special election. If the vacancy happens in session or within 45 days of the session convening, the governor must call for an election as soon as possible with at least an 18-day notice. All other special elections require a 40-day notice as long the election does not happen on the same day as a school election within the district.[1]
See sources: Iowa Code § 69.14
About the legislature
The Iowa General Assembly is Iowa's state legislature. It consists of the lower House of Representatives and the upper State Senate. The boxes below show the partisan composition of both chambers directly before and after the November 2016 general election. For the most up-to-date numbers on partisan composition in this legislature, see here (Senate) and here (House).
| Iowa State Senate | |||
|---|---|---|---|
| Party | As of November 7, 2016 | After November 8, 2016 | |
| Democratic Party | 25 | 20 | |
| Republican Party | 23 | 29 | |
| Independent | 1 | 1 | |
| Vacancy | 1 | 0 | |
| Total | 50 | 50 | |
| Iowa House of Representatives | |||
|---|---|---|---|
| Party | As of November 7, 2016 | After November 8, 2016 | |
| Democratic Party | 43 | 41 | |
| Republican Party | 57 | 59 | |
| Total | 100 | 100 | |
Special elections
Click [show] to the right of the district name for more information:
January 16, 2018
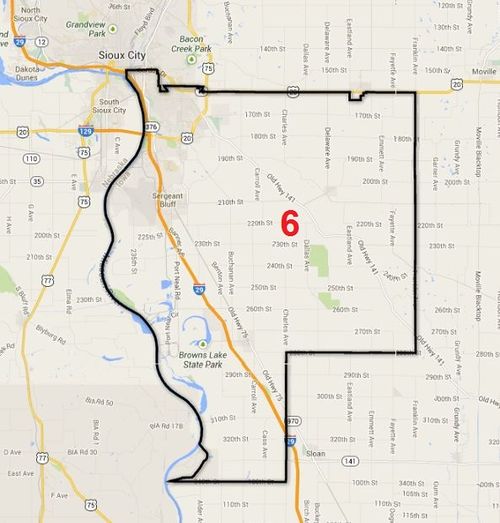
| ☑ Iowa House of Representatives District 6 | |||||||||||||||||||||||||||||||
|---|---|---|---|---|---|---|---|---|---|---|---|---|---|---|---|---|---|---|---|---|---|---|---|---|---|---|---|---|---|---|---|
|
A special election for the position of Iowa House of Representatives District 6 was held on January 16, 2018. The filing deadline for candidates to run in this election was January 2, 2018.[2] The seat became vacant after Jim Carlin (R) was elected to the state Senate in a special election on December 12, 2017. Rita DeJong (D) and Jacob Bossman (R) faced off in the special election.[3] Bossman (R) was the winner.[4]
| |||||||||||||||||||||||||||||||
April 10, 2018
| ☑ Iowa State Senate District 25 | |||||||||||||||||||||||||||||||
|---|---|---|---|---|---|---|---|---|---|---|---|---|---|---|---|---|---|---|---|---|---|---|---|---|---|---|---|---|---|---|---|
|
A special election for the position of Iowa State Senate District 25 was called for April 10, 2018.[5] The candidate filing deadline was on March 16, 2018.[6] Annette Sweeney (R) defeated Tracy Freese (D) in the special election.[7] The seat became vacant following Bill Dix's (R) resignation after a website published photos and video of him kissing a female lobbyist.[8]
| |||||||||||||||||||||||||||||||
Special elections throughout the country
In 2018, 99 state legislative special elections were held in 26 states. Between 2011 and 2017, an average of 74 special elections took place each year.
Breakdown of 2018 special elections
In 2018, special elections for state legislative positions were held for the following reasons:
- 58 due to appointment, election, or the seeking of election to another position
- 16 due to a retirement
- 10 due to a resignation related to criminal charges
- 7 due to a resignation related to allegations of sexual misconduct
- 5 due to the death of the incumbent
- 2 due to a resignation to take a private sector job
- 1 due to an election being rerun
Impact of special elections on partisan composition
The partisan breakdown for the special elections was as follows:
- 42 Democratic seats
- 57 Republican seats
The table below details how many seats changed parties as the result of a special election in 2018. The number on the left reflects how many vacant seats were originally held by each party, while the number on the right shows how many vacant seats each party won in the special elections. In elections between 2011 and 2016, either the Democratic Party or Republican Party saw an average net gain of three seats across the country. In 2017, Democrats had a net gain of 11 seats.
Note: This table reflects information for elections that were held and not the total number of vacant seats.
| Partisan Change from Special Elections (2018) | |||
|---|---|---|---|
| Party | As of Special Election | After Special Election | |
| Democratic Party | 42 | 50 | |
| Republican Party | 57 | 49 | |
| Independent | 0 | 0 | |
| Total | 99 | 99 | |
Democrats gained 11 seats in 2017 special elections and eight seats in 2018 special elections. The table below details the results of special elections held in 2017 and 2018 cumulatively.
| Partisan Change from Special Elections (2017-2018) | |||
|---|---|---|---|
| Party | As of Special Election | After Special Election | |
| Democratic Party | 87 | 106 | |
| Republican Party | 110 | 91 | |
| Independent | 0 | 0 | |
| Total | 197 | 197 | |
Flipped seats
In 2018, 16 seats flipped as a result of state legislative special elections. Twelve seats flipped from Republican control to Democratic control. Four seats flipped from Democratic control to Republican control.
In New York, a Democratic candidate running on the Republican ticket won election to Assembly District 142 on April 24. The previous incumbent in that district was a Democrat. Due to the winning candidate's party affiliation, Assembly District 142 was not added to the list of flipped seats in 2018.
Seats flipped from R to D
- Wisconsin State Senate District 10 (January 16)
- Missouri House of Representatives District 97 (February 6)
- Florida House of Representatives District 72 (February 13)
- Kentucky House of Representatives District 49 (February 20)
- New Hampshire House of Representatives District Belknap 3 (February 27)
- Connecticut House of Representatives District 120 (February 27)
- New York State Assembly District 10 (April 24)
- Pennsylvania House of Representatives District 178 (May 15)
- Missouri State Senate District 17 (June 5)
- Wisconsin State Senate District 1 (June 12)
- South Carolina State Senate District 20 (November 6)
- Texas House of Representatives District 52 (November 6)
Seats flipped from D to R
- Pennsylvania House of Representatives District 48 (May 15)
- Texas State Senate District 19 (September 18)
- Louisiana House of Representatives District 10 (November 6)[9]
- Louisiana House of Representatives District 33 (November 6)
See also
- State legislative special elections, 2018
- State legislative special elections, 2017
- State legislative special elections, 2016
- Iowa State Legislature
Footnotes
- ↑ Iowa General Assembly, "Iowa Code - 2021," accessed February 9, 2021 (Statute 69.14)
- ↑ Iowa Secretary of State, "State Representative District 6 - Special Election," accessed December 22, 2017
- ↑ Iowa Secretary of State, "Candidate List," accessed January 3, 2018
- ↑ Woodbury County, Iowa, "Election Results," accessed January 16, 2018
- ↑ The Courier, "Special election April 10 to fill Dix's Iowa Senate seat," March 16, 2018
- ↑ We Are Iowa, "What happens to Bill Dix's seat in the Senate?" March 12, 2018
- ↑ Iowa Secretary of State, "Candidate Certification List," accessed April 5, 2018
- ↑ CBS News, "Iowa Senate leader Bill Dix resigns after video shows him kissing lobbyist," March 12, 2018
- ↑ The general election was cancelled after Wayne McMahen (R) was the only candidate to file for election.
| |||||||||||
 |
State of Iowa Des Moines (capital) |
|---|---|
| Elections |
What's on my ballot? | Elections in 2025 | How to vote | How to run for office | Ballot measures |
| Government |
Who represents me? | U.S. President | U.S. Congress | Federal courts | State executives | State legislature | State and local courts | Counties | Cities | School districts | Public policy |