Ballot measure readability scores, 2019
| 2019 U.S. state ballot measures | |
|---|---|
2020 »
« 2018
| |
 | |
| Overview | |
| Tuesday Count | |
| Scorecard | |
| Deadlines | |
| Requirements | |
| Lawsuits | |
| Readability | |
| Voter guides | |
| Election results | |
| Year-end analysis | |
| Campaigns | |
| Polls | |
| Media editorials | |
| Filed initiatives | |
| Finances | |
| Contributions | |
| Signature costs | |
| Ballot Measure Monthly | |
| Signature requirements | |
Have you subscribed yet?
Join the hundreds of thousands of readers trusting Ballotpedia to keep them up to date with the latest political news. Sign up for the Daily Brew.
| |
This page provides an overview of the readability scores of the ballot titles and summaries of ballot measures certified to go before voters in 2019.
A readability score is an estimation of the reading difficulty of a text. Measurements used in calculating readability scores include the number of syllables, words, and sentences in a text. Other factors, such as the complexity of an idea in a text, are not reflected in readability scores.
In 2019, 28 statewide ballot measures were certified for ballots in eight states. Voters in states with ballot measures read questions on their ballots asking them whether to approve or reject a measure. As the text of ballot measures is often multiple pages of statute or constitutional law, someone is tasked in each state with writing a shorter title and summary to appear on the ballot for the measures.
Readability index details
Ballotpedia uses two formulas, the Flesch Reading Ease (FRE) and Flesch-Kincaid Grade Level (FKGL), to compute scores for the titles and summaries of ballot measures. The FRE formula produces a score between a negative number and 100, with the highest score (100) representing a 5th-grade equivalent reading level and scores at or below zero representing college graduate-equivalent reading level. Therefore, the higher the score, the easier the text is to read. The FKGL formula produces a score equivalent to the estimated number of years of U.S. education required to understand a text. A score of five estimates that a U.S. 5th grade student would be able to read and comprehend a text, while a score of 20 estimates that a person with 20 years of U.S. formal education would be able to read and comprehend a text. Ballotpedia uses Readable.io to calculate the scores.
- Learn more about these formulas in the formulas section below.
Overview
2019 highlights
Analysis by state
Title and summary grades
| Readability averages by state | |||||
|---|---|---|---|---|---|
| State | Average title grade | Average # of words | Average summary grade | Average # of words | Number of measures |
| Colorado | 27 | 59 | N/A | N/A | 2 |
| Kansas | 23 | 108 | N/A | N/A | 1 |
| Louisiana | 19 | 41 | N/A | N/A | 4 |
| Maine | 17 | 30 | N/A | N/A | 2 |
| New Jersey | 17 | 70 | 13 | 171 | 1 |
| Pennsylvania | 10 | 73 | N/A | N/A | 1 |
| Texas | 20 | 28 | N/A | N/A | 10 |
| Washington | 9 | 40 | 15[1] | 82[2] | 15 |
Title and summary ease rating
Expand the table for Flesch Reading Ease averages by state by clicking [show] below.
| Readability averages by state | |||||
|---|---|---|---|---|---|
| State | Average title ease | Average # of words | Average summary ease | Average # of words | Number of measures |
| Colorado | 10 | 59 | N/A | N/A | 2 |
| Kansas | -6 | 108 | N/A | N/A | 1 |
| Louisiana | 15 | 41 | N/A | N/A | 4 |
| Maine | 30 | 30 | N/A | N/A | 2 |
| New Jersey | 18 | 70 | 34 | 171 | 1 |
| Pennsylvania | 43 | 73 | N/A | N/A | 1 |
| Texas | 3 | 28 | N/A | N/A | 10 |
| Washington | 48 | 40 | N/A | N/A | 15 |
Analysis by the author of ballot language
The person or office responsible for drafting the ballot language for statewide ballot measures varies by state. In some states, the ballot language for different types of measures is drafted by different persons or offices. Moreover, some states require collaboration. For example, the secretary of state might draft the language, but it requires approval by the attorney general.
| Readability averages by state | ||||||
|---|---|---|---|---|---|---|
| Author type | Average title grade | Min-max range | Number of measures | Number of states | ||
| State legislature | 20 | 12-31 | 20 | 6 | ||
| Attorney general | 9 | 6-15 | 15 | 2[3] | ||
| Initiative petitioners | 10 | N/A | 1 | 1 | ||
Historical readability scores
2018 ballot measures
- See also: Ballot measure readability scores, 2018
In 2018, the average Flesch-Kincaid Grade Level for the ballot titles or questions of all statewide ballot measures was between 19 and 20. The FKGL scores of the 167 statewide ballot measures ranged from eight to 42 years of formal U.S. education.
Average ballot title grades were lowest for language written by the Florida Constitution Revision Commission (10), initiative petitioners (15), and attorneys general (16).
2017 ballot measures
- See also: Ballot measure readability scores, 2017
The average FKGL score for 2017 ballot measure titles was 20 years of formal U.S. education. The average FRE score for 2017 ballot measure titles was 21. Both of these indices state that a graduate school-level education was required to read and comprehend the average ballot measure title in 2017.
The FKGL scores of the 27 statewide ballot measure titles ranged from 7 to 42 years of formal U.S. education.
Reilly and Richey (2011)
Political scientists Shauna Reilly and Sean Richey conducted a study of 1,211 statewide ballot measures from 1997 to 2007 and concluded that more voters skipped voting on ballot measures when the titles and summaries were harder to read. To conduct the analysis, Reilly and Richey found the readability scores of the measures using the Flesch-Kincaid Grade Level formula. They found that:[4]
- Oklahoma measures had the lowest average readability score at grade level 9.
- New Mexico measures had the highest average readability score at grade level 28.
- Colorado had both the highest score and lowest score for individual measures, with one at grade level 5 and one at grade level 95. Colorado had the second-highest level of variation in readability scores between measures.
- Only four states—Oklahoma, Connecticut, North Carolina, and South Dakota—had average readability scores equivalent to a high school grade level (9-12) in the U.S. All other states measured had scores above a high school grade level.
2019 readability scores
Formulas
The Flesch Reading Ease and Flesch-Kincaid Grade Level formulas use the same variables and are inversely correlated, meaning that as one increases the other decreases.
Flesch Reading Ease
In the 1940s, Rudolf Flesch developed the Flesch Reading Ease (FRE) test. The U.S. Department of Defense uses the FRE to help craft its documents and manuals.[5] The FRE computes a score based on the number of syllables, the number of words, and the number of sentences in a text. The FRE formula is as follows:[6]
The FRE formula was designed to produce a score between 0 and 100, with the highest score (100) representing a 5th-grade equivalent reading level and the lowest score (0) representing college graduate-equivalent reading level. However, a score can be negative, representing increased difficulty. Therefore, the higher the score, the easier the text is to read. Rudolf Flesch created the following guide to interpreting FRE scores:[6]
| Score | School level |
|---|---|
| 90 to 100 | 5th grade |
| 80 to 90 | 6th grade |
| 70 to 80 | 7th grade |
| 60 to 70 | 8th and 9th grade |
| 50 to 60 | 10th to 12th grade |
| 30 to 50 | College |
| 0 to 30 | College graduate |
Flesch-Kincaid Grade Level
In 1975, J. Peter Kincaid recalculated FRE to give a score in the form of a U.S. school grade level for use by the U.S. Navy. This new formula became known as the Flesch-Kincaid Grade Level (FKGL) test. Like FRE, the FKGL computes a score based on the number of syllables, the number of words, and the number of sentences in a text. The FKGL formula is as follows:[7]
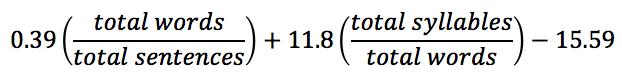
The FKGL produces a score equivalent to the estimated number of years of education required to understand a text. A score of 9 estimates that a U.S. 9th grade student would be able to read and comprehend a text, while a score of 18 estimates that a person with 18 years of U.S. formal education would be able to read and comprehend a text.[4]
Limitations
As the FRE and FKGL, along with other readability tests, do not measure the difficulty or complexity of the ideas expressed in ballot measure titles and summaries, they may underestimate or overestimate the ability of voters to comprehend a text. Political scientist Shauna Reilly, who utilizes readability indices in her research, noted their limitations, stating:[5]
| “ | There are limitations to the value of these measurements. No mathematical formula can tell us how complex the ideas of the passage are nor whether the content is in a logical order. Further, these mathematical equations exist in a vacuum and cannot explain the context of the passage.[8] | ” |
Prior research
Ballot Question Readability and Roll-off: The Impact of Language Complexity
In 2011, political scientists Shauna Reilly and Sean Richey published an article in Political Research Quarterly on research they conducted to answer the question of whether the difficulty or complexity of ballot measure language correlated with voters skipping voting on a ballot measure. The authors referred to voters casting ballots but skipping a ballot measure as voter roll-off. To measure the difficulty or complexity of ballot measure language, Reilly and Richey calculated Flesch-Kincaid Grade Level scores for 1,211 statewide ballot measures from 1997 to 2007. Reilly and Richey concluded that lower readability scores correlated with higher rates of voter roll-off. In their model accounting for state and year variations, Reilly and Richey only found one variable with a stronger influence on voter roll-off than readability—whether or not a ballot measure was on a primary election ballot compared to a special election ballot.[4]
Reilly and Richey calculated the mean Flesch-Kincaid Grade Level score for each state, except Arkansas, Illinois, and West Virginia, with at least one ballot measure during the 10-year period from 1997 to 2007. The state with the highest mean score was New Mexico, which had a mean FKGL score of 28 years of education. The state with the lowest mean score was Oklahoma, which had a mean FKGL score of nine years of education. The following table is from Reilly and Richey's research and contains the number of ballot measures analyzed in each state, the mean, minimum, and maximum readability score of measures in each state, and the standard deviation of the readability scores for measures in each state:[4][9]
| State | Measures | Mean | Mean U.S. equivalent | Standard deviation[9] | Minimum | Maximum |
|---|---|---|---|---|---|---|
| Oklahoma | 38 | 9 | High school | 1.1 | 7 | 12 |
| Connecticut | 1 | 11 | High school | 0 | 11 | 11 |
| North Carolina | 1 | 11 | High school | 0 | 11 | 11 |
| South Dakota | 36 | 12 | High school | 2.1 | 7 | 17 |
| Alaska | 30 | 13 | Associate's degree | 5.3 | 8 | 30 |
| California | 105 | 13 | Associate's degree | 1.8 | 9 | 18 |
| North Dakota | 13 | 13 | Associate's degree | 2.8 | 9 | 18 |
| Idaho | 16 | 14 | Associate's degree | 2.3 | 12 | 20 |
| Iowa | 5 | 14 | Associate's degree | 4 | 11 | 21 |
| Massachusetts | 18 | 14 | Associate's degree | 2.1 | 10 | 19 |
| Michigan | 18 | 14 | Associate's degree | 3.1 | 9 | 21 |
| Mississippi | 3 | 14 | Associate's degree | 5 | 8 | 18 |
| Oregon | 94 | 14 | Associate's degree | 1.7 | 11 | 18 |
| Rhode Island | 35 | 14 | Associate's degree | 6.1 | 6 | 33 |
| Washington | 57 | 15 | Bachelor's degree | 2.8 | 10 | 22 |
| Montana | 29 | 16 | Bachelor's degree | 7.4 | 11 | 52 |
| New Hampshire | 8 | 16 | Bachelor's degree | 5 | 10 | 27 |
| Utah | 6 | 16 | Bachelor's degree | 5.3 | 10 | 24 |
| Arizona | 70 | 17 | Master's degree | 3.1 | 11 | 26 |
| Florida | 40 | 17 | Master's degree | 5 | 8 | 38 |
| Indiana | 6 | 17 | Master's degree | 3.5 | 13 | 23 |
| Louisiana | 61 | 17 | Master's degree | 6.8 | 8 | 44 |
| Ohio | 19 | 17 | Master's degree | 4.9 | 9 | 30 |
| Tennessee | 6 | 17 | Master's degree | 5.8 | 10 | 25 |
| Vermont | 1 | 17 | Master's degree | 0 | 17 | 17 |
| Alabama | 32 | 18 | Master's degree | 6.4 | 12 | 35 |
| Kansas | 4 | 18 | Master's degree | 1.7 | 16 | 20 |
| Maine | 66 | 18 | Master's degree | 6.6 | 8 | 37 |
| Nebraska | 37 | 18 | Master's degree | 3.4 | 11 | 25 |
| Wyoming | 12 | 18 | Master's degree | 12 | 12 | 25 |
| Missouri | 27 | 19 | Ph.D. | 8.2 | 8 | 44 |
| Nevada | 36 | 19 | Ph.D. | 6.4 | 11 | 42 |
| New York | 8 | 19 | Ph.D. | 8.3 | 8 | 35 |
| Maryland | 11 | 20 | Ph.D. | 4.1 | 13 | 26 |
| Texas | 84 | 20 | Ph.D. | 12 | 12 | 45 |
| Wisconsin | 3 | 20 | Ph.D. | 16.6 | 17 | 23 |
| Georgia | 33 | 22 | Ph.D. | 10.4 | 10 | 57 |
| Hawaii | 10 | 22 | Ph.D. | 10.9 | 10 | 44 |
| Kentucky | 7 | 22 | Ph.D. | 6.1 | 14 | 30 |
| Virginia | 3 | 22 | Ph.D. | 3.2 | 19 | 25 |
| New Jersey | 20 | 23 | Ph.D. | 6.6 | 13 | 34 |
| Pennsylvania | 6 | 24 | Ph.D. | 5.4 | 17 | 33 |
| South Carolina | 19 | 25 | N/A | 10.8 | 16 | 63 |
| Minnesota | 1 | 26 | N/A | 0 | 26 | 26 |
| Colorado | 62 | 27 | N/A | 15.2 | 5 | 95 |
| New Mexico | 14 | 28 | N/A | 9.3 | 12 | 39 |
| Arkansas | N/A | N/A | N/A | N/A | N/A | N/A |
| Illinois | N/A | N/A | N/A | N/A | N/A | N/A |
| West Virginia | N/A | N/A | N/A | N/A | N/A | N/A |
See also
- 2019 ballot measures
- Ballot measure readability scores, 2018
- Ballot measure readability scores, 2017
- Ballot title
External links
Additional reading
Footnotes
- ↑ Three of Washington's measures had ballot summaries. This number reflects the average of the three.
- ↑ Three of Washington's measures had ballot summaries. This number reflects the average of the three.
- ↑ In one case the Secretary of State and Attorney General collaborated on the language.
- ↑ 4.0 4.1 4.2 4.3 Reilly, Shauna, and Sean Richey. "Ballot Question Readability and Roll-off: The Impact of Language Complexity." Political Research Quarterly 64, 1. (2011): 59-67.
- ↑ 5.0 5.1 Reilly, S. (2015). "Language Assistance under the Voting Rights Act: Are Voters Lost in Translation?" Lanham, MD: Lexington Books. (pages 55-56)
- ↑ 6.0 6.1 University of Canterbury, "How to Write Plain English," accessed April 19, 2017
- ↑ U.S. Naval Technical Training Command, "Derivation of new readability formulas (Automated Readability Index, Fog Count, and Flesch Reading Ease Formula) for Navy enlisted personnel," February 1975
- ↑ Note: This text is quoted verbatim from the original source. Any inconsistencies are attributable to the original source.
- ↑ 9.0 9.1 The standard deviation (SD) measures how spread out around the mean the scores of individual measures were. The smaller the standard deviation, the closer the scores of individual measures were to the mean. The larger the standard deviation, the farther apart the scores of individual measures were to the mean.
| |||||||||||||||||||