Wisconsin school board elections, 2016
Presidential • U.S. Senate • U.S. House • State Senate • State Assembly • State judges • Local judges • State ballot measures • School boards • Municipal • Recalls • Candidate ballot access |
← 2015 |
2017 →
|
List of elections
General elections for Wisconsin school boards were held on April 5, 2016. If more than two candidates filed per seat up for election in any given district, the district was required to hold a primary election on February 16, 2016. Special elections for unexpired board terms were held in conjunction with the general election cycle.
Twelve Wisconsin school districts were among America's largest school districts by enrollment in the 2013–2014 school year. In addition to covering those districts, Ballotpedia also covered Wisconsin's 50 largest school districts.
Here are several quick facts about Wisconsin's school board elections in 2016:
- The largest school district by enrollment with an election in 2016 was the Madison Metropolitan School District with 27,185 K-12 students.
- The smallest Wisconsin school district among the nation's top 1,000 largest with an election in 2016 was the West Allis-West Milwaukee School District with 9,725 K-12 students.
- The Racine Unified School District had the most seats on the 2016 ballot with nine seats up for election.
- Sixteen of the 50 largest districts tied for the fewest seats on the 2016 ballot with two seats up for election each.
The districts listed below served 378,900 K-12 students during the 2013-2014 school year, according to the National Center for Education Statistics. Click on the district name for more information on the district and its school board elections. Districts with asterisks (*) next to the number of seats up for election held special elections in conjunction with their general elections.
| 2016 Wisconsin School Board Elections | |||||||
|---|---|---|---|---|---|---|---|
| District | Primary date | General date | Regular term (years) | Seats up for election | Total board seats | Student enrollment | |
| Appleton Area School District | 2/16/2016 | 4/5/2016 | 3 | 2 | 7 | 16,224 | |
| Beloit School District | 2/16/2016 | 4/5/2016 | 3 | 4* | 7 | 7,116 | |
| Chippewa Falls Area School District | 2/16/2016 | 4/5/2016 | 3 | 3 | 7 | 5,081 | |
| D.C. Everest Area School District | 2/16/2016 | 4/5/2016 | 3 | 3 | 7 | 5,957 | |
| De Pere School District | 2/16/2016 | 4/5/2016 | 3 | 3 | 7 | 4,148 | |
| Eau Claire Area School District | 2/16/2016 | 4/5/2016 | 3 | 4* | 7 | 11,032 | |
| Elmbrook School District | 2/16/2016 | 4/5/2016 | 3 | 2 | 7 | 6,945 | |
| Fond du Lac School District | 2/16/2016 | 4/5/2016 | 3 | 3 | 7 | 7,460 | |
| Franklin Public School District | 2/16/2016 | 4/5/2016 | 3 | 3 | 7 | 4,418 | |
| Germantown School District | 2/16/2016 | 4/5/2016 | 3 | 3 | 7 | 3,933 | |
| Green Bay Area Public School District | 2/16/2016 | 4/5/2016 | 3 | 3 | 7 | 21,006 | |
| Greenfield School District | 2/16/2016 | 4/5/2016 | 3 | 4* | 7 | 3,924 | |
| Hamilton School District | 2/16/2016 | 4/5/2016 | 3 | 2 | 7 | 4,685 | |
| Holmen School District | 2/16/2016 | 4/5/2016 | 3 | 2 | 7 | 3,898 | |
| Howard-Suamico School District | 2/16/2016 | 4/5/2016 | 3 | 3 | 7 | 5,886 | |
| Hudson School District | 2/16/2016 | 4/5/2016 | 3 | 2 | 7 | 5,597 | |
| Janesville School District | 2/16/2016 | 4/5/2016 | 3 | 3 | 9 | 10,390 | |
| Kaukauna Area School District | 2/16/2016 | 4/5/2016 | 3 | 3 | 7 | 3,953 | |
| Kenosha Unified School District | 2/16/2016 | 4/5/2016 | 3 | 2 | 7 | 22,602 | |
| Kettle Moraine School District | 2/16/2016 | 4/5/2016 | 3 | 2 | 7 | 4,117 | |
| Kimberly Area School District | 2/16/2016 | 4/5/2016 | 3 | 2 | 7 | 4,913 | |
| La Crosse School District | 2/16/2016 | 4/5/2016 | 3 | 3 | 9 | 6,829 | |
| Madison Metropolitan School District | 2/16/2016 | 4/5/2016 | 3 | 3 | 7 | 27,185 | |
| Manitowoc School District | 2/16/2016 | 4/5/2016 | 3 | 3 | 7 | 5,210 | |
| Marshfield School District | 2/16/2016 | 4/5/2016 | 3 | 2 | 7 | 4,014 | |
| McFarland School District | 2/16/2016 | 4/5/2016 | 3 | 2 | 5 | 4,355 | |
| Menomonee Falls School District | 2/16/2016 | 4/5/2016 | 3 | 3 | 7 | 4,200 | |
| Middleton-Cross Plains School District | 2/16/2016 | 4/5/2016 | 3 | 3 | 9 | 6,654 | |
| Mukwonago School District | 2/16/2016 | 4/5/2016 | 3 | 3 | 9 | 4,710 | |
| Muskego-Norway School District | 2/16/2016 | 4/5/2016 | 3 | 2 | 7 | 4,886 | |
| Neenah Joint School District | 2/16/2016 | 4/5/2016 | 3 | 3 | 9 | 6,226 | |
| New Berlin School District | 2/16/2016 | 4/5/2016 | 3 | 3 | 7 | 4,602 | |
| Oak Creek-Franklin Joint School District | 2/16/2016 | 4/5/2016 | 3 | 4* | 7 | 6,447 | |
| Oconomowoc Area School District | 2/16/2016 | 4/5/2016 | 3 | 2 | 7 | 5,224 | |
| Oshkosh Area School District | 2/16/2016 | 4/5/2016 | 3 | 2 | 7 | 9,957 | |
| Racine Unified School District | 2/16/2016 | 4/5/2016 | 3 | 9* | 9 | 20,301 | |
| Sheboygan Area School District | 2/16/2016 | 4/5/2016 | 3 | 3 | 9 | 10,288 | |
| Stevens Point Area Public School District | 2/16/2016 | 4/5/2016 | 3 | 4* | 9 | 7,353 | |
| Sun Prairie Area School District | 2/16/2016 | 4/5/2016 | 3 | 3 | 7 | 7,598 | |
| Superior School District | 2/16/2016 | 4/5/2016 | 3 | 2 | 7 | 4,667 | |
| Verona Area School District | 2/16/2016 | 4/5/2016 | 3 | 2 | 7 | 5,433 | |
| Watertown School District | 2/16/2016 | 4/5/2016 | 3 | 3 | 9 | 3,864 | |
| Waukesha School District | 2/16/2016 | 4/5/2016 | 3 | 3 | 9 | 13,678 | |
| Waunakee Community School District | 2/16/2016 | 4/5/2016 | 3 | 3 | 7 | 4,042 | |
| Wausau School District | 2/16/2016 | 4/5/2016 | 3 | 3 | 9 | 8,663 | |
| Wauwatosa School District | 2/16/2016 | 4/5/2016 | 3 | 3 | 7 | 7,204 | |
| West Allis-West Milwaukee School District | 2/16/2016 | 4/5/2016 | 3 | 3 | 9 | 9,725 | |
| West Bend School District | 2/16/2016 | 4/5/2016 | 3 | 2 | 7 | 7,008 | |
| Wisconsin Rapids School District | 2/16/2016 | 4/5/2016 | 3 | 2 | 7 | 5,292 | |
Issues
School districts across the state of Wisconsin confronted various issues during 2016. Voters were asked to increase tax levies in five of the largest school districts in the state. There were debates surrounding school curriculum and changes to school board election formats and size. The issues highlighted below are some of the stories that were covered by Ballotpedia in the Wisconsin school district elections of 2016.
Parents seek to ban three books in Waukesha; district refuses
Parents in the Waukesha School District in Wisconsin sought a ban on the book Looking for Alaska by John Green, but the district refused the request. On July 25, 2014, the school district's consideration committee—made up of teachers and school officials—unanimously decided to keep the book on the district's shelves and recommended reading lists. The parents who sought the ban said that the book had inappropriate language and advanced sexual content and that they did not believe it was proper reading for middle school and high school students.[1][2][3]
Bans on two additional books, The Kite Runner by Khaled Hosseini and Chinese Handcuffs by Chris Crutcher, were also sought by parents who claimed the books' scenes of gang rape, brutality, and violence were not appropriate for readers under the age of 18.[3] The Kite Runner was used in the district's 10th grade English curriculum, but district officials said students had the opportunity to opt out and choose a different book to read in exchange. Chinese Handcuffs was not used in the district's curriculum, but it was housed in the district's libraries. The consideration committee unanimously refused to ban the books in their meeting on August 20, 2014.[4]
Election format change and increased board size
- See also: Battles over school governance (2016)
Due to a state law passed in July 2015, the Racine Unified School District school board shifted from holding at-large elections to holding by-district elections in 2016. All nine board seats were up for election in 2016, with each seat located in a newly created geographic district. State Sen. Van Wanggaard (R-21) and State Assemblyman Tom Weatherston (R-62) wrote the legislation specifically for Racine, with language requiring by-district elections for cities with populations between 75,000 and 100,000 residents encompassing at least two villages. This legislation was written in the wake of an effort by nearby communities to break away from the district. State Assembly Speaker Robin Vos (R-63) argued that the bill would provide equal representation to all parts of the district. State Assemblyman Cory Mason (D-66) opposed the measure as "an assault on local control" that invalidated previous election results.[5]


In August 2015, school board members debated how to create board districts by the state's deadline of November 1, 2015. Dennis Wiser proposed hiring an outside firm to draw the boundaries for board approval. He argued that an outside firm could simplify the drafting process by reviewing the community's needs. Wiser's proposal was defeated in a 4-3 vote, and the board voted 5-2 to create a seven-member apportionment committee to propose boundaries for district seats. Melvin Hargrove, Chuck Goodremote, Pamala Handrow, Kim Plache, and Julie McKenna voted for the committee proposal, while Wiser and Michael Frontier opposed the measure. Hargrove concluded that the committee would be more transparent than an outside firm. This committee consisted of three board members, one attorney, one district employee, and two community members.[6]
The committee submitted two maps to the board, and public review of the proposals began at a school board meeting held on October 5, 2015. The initial configuration had each board seat represent approximately 15,450 residents. All nine seats were slated for elections in 2016, though three seats were for one-year terms and another three seats were for two-year terms to facilitate staggered elections starting in 2017. Both maps included five seats for the city of Racine, with the villages of Caledonia and Mount Pleasant each representing a majority of the population for one seat. Each proposal had two board seats representing sections of the city where minority residents were a majority of the population. The city's chapter of the National Association for the Advancement of Colored People (NAACP) lobbied for three districts referred to as majority-minority districts.[7] During a special board meeting on October 27, 2015, the board voted 5-4 to approve the Proposal 5 map. Chuck Goodremote, Melvin Hargrove, Pamala Handrow, John Koetz, and Kim Plache voted for the map, while Dennis Wiser, Don Nielsen, Michael Frontier, and Julie McKenna voted for an alternate proposal.[8]
Oak Creek-Franklin Joint School District
The Oak Creek-Franklin Joint School District also made changes to how its board was governed in the 2016 spring election, but rather than responding to a directive from the state, the changes were advocated by a local community group. The group YES for Oak Creek Schools pushed for expanding the membership of the board from five members to seven. The decision was put to the community at the school district's annual meeting on August 24, 2015. Board members Mark Verhalen and Kathleen Borchardt, along with some members of the audience, voted against adding more members, but the majority voted to expand the board.[9]

YES for Oak Creek Schools was founded in 2014 as a referendum advocacy group and continued to advocate other district issues after the referendum passed, including an expansion of the school board's size. The group had to gather at least 500 signatures and submit them to the board 30 days before the annual meeting in order to add an agenda item. On July 23, 2015, the group announced it had submitted 553 signatures to place the matter on the district's annual meeting agenda.[10][11] Annual school board meetings in Wisconsin differ from regular school board meetings, as all residents attending the annual meeting are allowed to vote on the issues discussed. The Wisconsin Association of School Boards explains the process:
| “ | The annual school district meeting plays a special role in the governance of 377 of Wisconsin's 424 school districts. Electors in these districts — which are classified as either common school districts or union high school districts — have special powers reserved to them as a body at the annual meeting. State statutes (see Appendix A) set forth the basic requirements for holding the annual meeting and outline the powers of the electors at the annual meeting.
Electors are individuals who are eligible to vote in school district elections. As school officials are well aware, however, there is more to the annual meeting than the statutory requirements. Often described as grassroots democracy in action, the annual meeting provides district residents with an opportunity to critique the operation of the school district. It is also a good time for the school board and administrative staff to help the community focus on the achievements, needs and future of the district.[12] |
” |
| —Wisconsin Association of School Boards (May 2015)[13] | ||
YES for Oak Creek Schools argued that the board size should be increased in order to allow for more parent and community voices to be heard. The group also said that only one other district in Wisconsin's 50 largest districts by enrollment—the McFarland School District—had fewer than seven board members. The rest had seven or nine.[14]
Verhalen did not agree that the board should be expanded. He said he thought board business had been managed "fairly well." He also said, "I don't see any advantage to adding more people to the board at this time."[9]
Before the vote, YES for Oak Creek Schools described how the board would transition from five to seven members on its website:
| “ | If we are successful, the new positions would be added in April 2016, however, the terms of the new positions would be staggered. There would be four people elected in April 2016. The top two vote-getters would have the 3-year terms (those seats currently occupied by Frank Carini and Jon Jossart). The next top vote-getter would have a 2-year term (making him or her up for election with Kathleen Borchert's and Sheryl Cerniglia's positions in 2018), and the fourth highest vote-getter would have a 1-year term (making him or her up for election with Mark Verhalen's position in 2017). After that, all elections would be for three-year terms. Currently we have 2 - 1 - 2 up for election over a three-year period. By staggering the terms of the two additional positions, we would have 2 - 2 - 3. That way there is never a majority of the board up for election in any one year. This staggering of the new positions is required by the law.[12] | ” |
| —YES for Oak Creek Schools (2015)[14] | ||
In addition to increasing the size of the board, the proposal also sought to extend the district's existing stipend to the new board members. According to YES for Oak Creek Schools:
| “ | Of the 50 largest districts in Wisconsin, stipends range from $750 to $18,000 annually. A small number of districts pay $25 to $100 per meeting, and a few do not compensate school board members at all. Oak Creek-Franklin provides around $5,000 annually to each board member. We believe this cost is a minimal investment considering the larger benefit to the community.[12] | ” |
| —YES for Oak Creek Schools (2015)[14] | ||
Referendums
Five of the largest school districts in the state put nine referendums and tax levies on the ballot alongside school board elections on April 5, 2016. School boards in these districts sought funding for athletic facility upgrades, building expansions to accommodate larger enrollments, and safety improvements. All but one of the referendums was passed by voters.
At least three of the other largest districts also contemplated ballot measures, but they looked to put them on the November ballot.[15]
Fall referendums
Eau Claire Area School District
In a meeting held on August 1, 2016, six of the seven Eau Claire school board members voted to place an operational referendum question on the November 8, 2016, general election ballot. The seventh board member, Aaron Harder, was absent from the meeting.[16] Voters approved the referendum with 64.6 percent of the vote.[17] The referendum will provide an additional $5.8 million to the school district each year for 15 years, beginning in 2017. This amounts to roughly $87.9 million by 2031 collected through a 95 cent mill. The table below shows the estimated tax increase for the proposed referendum:
Estimated tax increase 2017-2031[18] Total property Value Cost per year Cost per month $100,000 $95.00 $7.92 $200,000 $190.00 $15.83 $300,000 $285.00 $23.75
School board vice president Joe Luginbill said the district needed increased funding to offset revenue shortfalls. A deficit of $3.9 million was projected for the 2016-2017 school year.[19] In 2016, Eau Claire was the eight-largest district in the state and ranked 272nd in spending out of the 424 total school districts in Wisconsin. "We don't have a spending problem in our school district. We haven't for 20 years. We have a revenue problem, and that's what we're gonna be talking about with the voters," said Lunginbill. He blamed a state-imposed revenue cap, passed in 1993, for many of the district's budget problems. The cap was intended to control property tax and state aid increases.[18][20]
Many community members expressed support for the referendum and the school board. Volunteers with Support Eau Claire Public Schools offered to raise awareness for the cause. Counsel for the Eau Claire school district approved the referendum's wording. Ultimately, the fate of the referendum rested in the hands of the voters who decided at the polls.
Oconomowoc Area School District
On August 16, 2016, the Oconomowoc Area School Board unanimously approved a facilities referendum for the general election ballot on November 8, 2016. This referendum question asked voters to approve or reject a mill rate increase to raise $54.9 million for facilities improvements. The proposed improvements included expansion or improvements for the following schools:[21]
- Meadow View Elementary School
- Ixonia Elementary School
- Greenland Elementary School
- Park Lawn Elementary School
- Oconomowoc High School Main Campus
- Oconomowoc High School East Campus
District residents approved the referendum.[22] The mill rate will increase by $0.40 per $1,000 property value over 20 years.[21]
Superintendent Roger Rindo announced in March 2016 that surveys regarding facilities advisory commission (FAC) proposals would be mailed to district residents in April 2016 with responses to be discussed at a public meeting in May 2016. The FAC recommended a plan including renovation and expansion of Oconomowoc High School, construction of a new Meadow View School building, and renovation of Ixonia Elementary School. This plan would have required $46.9 million for the high school ($32/$100,000 of home value), $31.7 million for Meadow View ($22/$100,000 of home value), and $9.7 million for Ixonia ($7/$100,000 of home value) financed by property tax increases noted in parentheses.[23]
Findings from the district's survey were presented at a public meeting on May 17, 2016. A total of 2,435 responses were received, which equaled 16 percent of all surveys distributed to district residents. District officials concluded that voters would approve measures that covered renovation of Ixonia, urgent building upgrades at two elementary schools, and the construction of a new Meadow View building. The final report indicated that voters were unlikely to support measures funding renovation of the high school or the district's base plan combining Ixonia, Meadow View, and high school renovation.[24]
Marshfield School District
| Previous MSD referendums[25] | ||||
|---|---|---|---|---|
| Year | Terms | Passed | In favor | Against |
| 2012 | Tax increase of $10 million over four years |
Yes | 7,807 | 6,076 |
| 2008 | Tax increase of $13.5 million over five years |
Yes | 5,892 | 4,760 |
| 2005 | Allow $21.3 million in debt | Yes | 5,211 | 3,529 |
| 2004 | Allow $25.6 million in debt | No | 3,764 | 4,044 |
| 2003 | Allow $31.4 million in debt | No | 3,484 | 4,339 |
| 2002 | Tax increase of $3 million over three years |
Yes | 4,825 | 3,009 |
The district put a referendum on the ballot in the November 2016 election. Voters decided on a $12 million tax increase for existing programs and operations in the district. The money will not be used on facility upgrades, according to the district's director of business services Patrick Saucerman. The referendum was approved by 59 percent of vote.[26]
The last referendum passed for the Marshfield School District was in 2012, when 56 percent of voters approved a tax increase of $10 million over the tax levy limits over four years. Prior to the 2012 measure, 55 percent of voters passed a $13.5 million increase in 2008.
In 2015, state lawmakers introduced a bill that would limit the number of times a district could put a referendum on the ballot. The bill would allow districts to introduce a referendum every two years. This would keep a district from asking for a tax increase in the next election following a failed referendum. The bill would also limit a referendum vote to the April and November elections in the state of Wisconsin.[25]
Spring referendums
Superior School District
A $92.5 million referendum was passed by voters in the Superior School District on April 5, 2016.[27] Just over half of that money, a total of $56 million, was earmarked for renovations and additions at Superior High School. Another $27 million was allocated to completely replace the Cooper Elementary School building. Two other schools needed their roofs replaced and another two needed new pavement. Other costs included in the referendum were an artificial turf softball field, improved security at all school buildings, and technology and equipment upgrades.[28][29]

Nearly 55 percent of voters cast ballots in favor of the referendum, raising property taxes by 61 cents per $1,000 of value. This meant a homeowner with property valued at $100,000 would see a total annual tax increase of $61 or a monthly increase of $5.08, according to Janna Stevens, district administrator of the Superior School District.[28][30]
Election trends
Trends in Wisconsin school board elections

Note: Ballotpedia extended its coverage of Wisconsin school districts in 2016 due to a grant. The statistics below only encompass the 12 Wisconsin districts in the top 1,000 districts by enrollment in the United States.
- See also: School boards in session: 2015 in brief

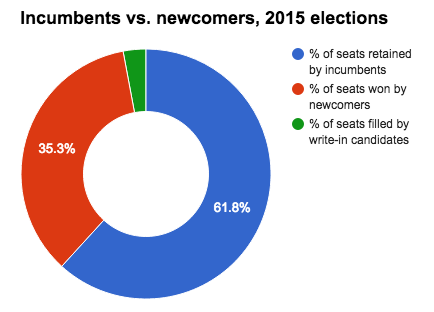
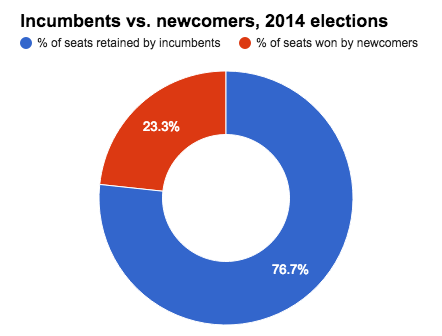
The state's 2015 school board elections saw a higher average number of candidates run per seat than the 2014 school board elections. Districts also had fewer unopposed seats in 2015, and more newcomers were elected to school boards. A total of 35.29 percent of seats went to newcomers in 2015, compared to 23.33 percent that went to newcomers in 2014.
The following sections analyze competitiveness and incumbency advantage in Wisconsin's school board elections. These districts did not utilize primary or runoff elections. Winners only had to receive a plurality, or relative majority, of votes to secure a seat. All of the school board elections held in the state in 2014 and 2015 were nonpartisan.
Though no primary elections were held in 2015, Wisconsin does require school districts to hold them to reduce the number of candidates if more than two file for any one school board seat up for election in the state. No runoff elections are held. In 2014, only the Kenosha Unified School District had enough candidates file to hold a primary.
Details of the data discussed here can be found in the table below.
Competitiveness
In 2015, elections held in Wisconsin's largest school districts attracted an average of 1.38 candidates per seat. This was higher than the average 1.4 candidates who ran per seat in the state in 2014. Over a third of the school board seats on the ballot in 2015 were unopposed, but the percentage was lower than the 46.67 percent that were unopposed in 2014.
Incumbency advantage
|
A total of 84 percent of incumbents who ran for re-election retained their seats in the state's 2015 school board elections. Twenty-five incumbents ran for 34 seats. Eight of those incumbents ran unopposed and automatically won another term, but 17 defeated challengers to keep their seats. In 2014, incumbents had a higher success rate, with 88.46 percent winning re-election. Twenty-six incumbents ran for 30 seats that year, and half of them were unopposed in their re-election bids. Ten defeated challengers to retain their seats. The map below details the success rates for incumbents who ran in the 2015 school board elections that were held in the largest school districts by enrollment in the U.S.
|
  |
Data table
| Wisconsin school board elections, 2014 - 2015 | ||||||||||
|---|---|---|---|---|---|---|---|---|---|---|
| 2014 | 2015 | |||||||||
| All candidates | ||||||||||
| Seats up | 30 | 34 | ||||||||
| Candidates | 42 | 47 | ||||||||
| Candidates/seat | 1.40 | 1.38 | ||||||||
| Unopposed seats | 14 | 13 | ||||||||
| % unopposed | 46.67% | 38.24% | ||||||||
| % seats won by newcomers | 23.33% | 35.29% | ||||||||
| Incumbents | ||||||||||
| Sought re-election | 26 | 25 | ||||||||
| Unopposed | 13 | 8 | ||||||||
| Retained | 23 | 21 | ||||||||
| % retained | 88.46% | 84.00% | ||||||||
Academic performance
- See also: Public education in Wisconsin
The sections below do not contain the most recently published data on this subject. If you would like to help our coverage grow, consider donating to Ballotpedia.
| Education terms |
|---|
| For more information on education policy terms, see this article. |
NAEP scores
- See also: NAEP scores by state
The National Center for Education Statistics provides state-by-state data on student achievement levels in mathematics and reading in the National Assessment of Educational Progress (NAEP). The table below presents the percentage of fourth and eighth grade students that scored at or above proficient in reading and math during school year 2012-2013. Wisconsin had a higher percentage of students score at or above proficient in all categories than students in Illinois and Michigan. However, students in Wisconsin fell below those in Minnesota.[31]
| Percent of students scoring at or above proficient, 2012-2013 | ||||
|---|---|---|---|---|
| Math - Grade 4 | Math - Grade 8 | Reading - Grade 4 | Reading - Grade 8 | |
| Wisconsin | 47% | 40% | 35% | 36% |
| Illinois | 39% | 36% | 34% | 36% |
| Michigan | 37% | 30% | 31% | 33% |
| Minnesota | 59% | 47% | 41% | 41% |
| United States | 41% | 34% | 34% | 34% |
| Source: United States Department of Education, ED Data Express, "State Tables" | ||||
Graduation, ACT and SAT scores
The following table shows the graduation rates and average composite ACT and SAT scores for Wisconsin and surrounding states during the 2012-2013 school year. All statements made in this section refer to that school year.[31][32][33]
In the United States, public schools reported graduation rates that averaged to about 81.4 percent. About 54 percent of all students in the country took the ACT, while 50 percent reported taking the SAT. The average national composite scores for those tests were 20.9 out of a possible 36 for the ACT, and 1498 out of a possible 2400 for the SAT.[34]
Wisconsin schools reported a graduation rate of 88 percent during the 2012-2013 school year, highest among neighboring states.
In Wisconsin, more students took the ACT than the SAT in 2013, earning an average ACT score of 22.1.
| Comparison table for graduation rates and test scores, 2012-2013 | |||||||
|---|---|---|---|---|---|---|---|
| State | Graduation rate, 2013 | Average ACT composite, 2013 | Average SAT composite, 2013 | ||||
| Percent | Quintile ranking** | Score | Participation rate | Score | Participation rate | ||
| Wisconsin | 88% | First | 22.1 | 71% | 1771 | 4% | |
| Illinois | 83.2% | Third | 20.6 | 100% | 1807 | 5% | |
| Michigan | 77% | Fourth | 19.9 | 100% | 1782 | 4% | |
| Minnesota | 79.8% | Fourth | 23 | 74% | 1780 | 6% | |
| United States | 81.4% | 20.9 | 54% | 1498 | 50% | ||
| **Graduation rates for states in the first quintile ranked in the top 20 percent nationally. Similarly, graduation rates for states in the fifth quintile ranked in the bottom 20 percent nationally. Sources: United States Department of Education, "ED Data Express" ACT.org, "2013 ACT National and State Scores" The Commonwealth Foundation, "SAT scores by state, 2013" | |||||||
Dropout rate
- See also: Public high school dropout rates by state for a full comparison of dropout rates by group in all states
The high school event dropout rate indicates the proportion of students who were enrolled at some time during the school year and were expected to be enrolled in grades nine through 12 in the following school year but were not enrolled by October 1 of the following school year. Students who have graduated, transferred to another school, died, moved to another country, or who are out of school due to illness are not considered dropouts. The average public high school event dropout rate for the United States remained constant at 3.3 percent for both school year 2010–2011 and school year 2011–2012. The event dropout rate for Wisconsin was lower than the national average at 2 percent in the 2010-2011 school year, and 1.9 percent in the 2011-2012 school year.[35]
State profile
State profile
| Demographic data for Wisconsin | ||
|---|---|---|
| Wisconsin | U.S. | |
| Total population: | 5,767,891 | 316,515,021 |
| Land area (sq mi): | 54,158 | 3,531,905 |
| Race and ethnicity** | ||
| White: | 86.5% | 73.6% |
| Black/African American: | 6.3% | 12.6% |
| Asian: | 2.5% | 5.1% |
| Native American: | 0.9% | 0.8% |
| Pacific Islander: | 0% | 0.2% |
| Two or more: | 2.1% | 3% |
| Hispanic/Latino: | 6.3% | 17.1% |
| Education | ||
| High school graduation rate: | 91% | 86.7% |
| College graduation rate: | 27.8% | 29.8% |
| Income | ||
| Median household income: | $53,357 | $53,889 |
| Persons below poverty level: | 15% | 11.3% |
| Source: U.S. Census Bureau, "American Community Survey" (5-year estimates 2010-2015) Click here for more information on the 2020 census and here for more on its impact on the redistricting process in Wisconsin. **Note: Percentages for race and ethnicity may add up to more than 100 percent because respondents may report more than one race and the Hispanic/Latino ethnicity may be selected in conjunction with any race. Read more about race and ethnicity in the census here. | ||
Presidential voting pattern
- See also: Presidential voting trends in Wisconsin
Wisconsin voted for the Democratic candidate in five out of the seven presidential elections between 2000 and 2024.
Pivot Counties (2016)
Ballotpedia identified 206 counties that voted for Donald Trump (R) in 2016 after voting for Barack Obama (D) in 2008 and 2012. Collectively, Trump won these Pivot Counties by more than 580,000 votes. Of these 206 counties, 23 are located in Wisconsin, accounting for 11.17 percent of the total pivot counties.[36]
Pivot Counties (2020)
In 2020, Ballotpedia re-examined the 206 Pivot Counties to view their voting patterns following that year's presidential election. Ballotpedia defined those won by Trump won as Retained Pivot Counties and those won by Joe Biden (D) as Boomerang Pivot Counties. Nationwide, there were 181 Retained Pivot Counties and 25 Boomerang Pivot Counties. Wisconsin had 21 Retained Pivot Counties and two Boomerang Pivot Counties, accounting for 11.60 and 8.00 percent of all Retained and Boomerang Pivot Counties, respectively.
More Wisconsin coverage on Ballotpedia
- Elections in Wisconsin
- United States congressional delegations from Wisconsin
- Public policy in Wisconsin
- Endorsers in Wisconsin
- Wisconsin fact checks
- More...
See also
| Wisconsin | School Boards | News and Analysis |
|---|---|---|
 |
 | |
Footnotes
- ↑ WISN2, "Waukesha school committee rejects request to ban book," July 25, 2014
- ↑ WHBL, "Waukesha School District parents challenging 3 books deemed inappropriate," July 27, 2014
- ↑ 3.0 3.1 Waukesha Now, "Waukesha mom seeks to have two novels banned from schools," August 19, 2014
- ↑ Waukesha Now, "Waukesha school committee denies parent's request to ban 'The Kite Runner,' 'Chinese Handcuffs,'" August 20, 2014
- ↑ The Journal Times, "State legislature eyes changing Unified board, related to separation movement," May 20, 2015
- ↑ The Journal Times, "Committee to draw Racine Unified voting boundaries," August 31, 2015
- ↑ The Journal Times, "Proposals carve Racine Unified into nine voting areas," October 3, 2015
- ↑ Racine Unified School District, "Official Proceedings," October 27, 2015
- ↑ 9.0 9.1 Oak Creek Now, "Oak Creek-Franklin School Board receives voter approval to add two more seats," August 24, 2015
- ↑ YES for Oak Creek Schools, "Home," accessed July 29, 2015
- ↑ Yes for Oak Creek Schools, "History," accessed February 6, 2016
- ↑ 12.0 12.1 12.2 Note: This text is quoted verbatim from the original source. Any inconsistencies are attributable to the original source.
- ↑ Wisconsin Association of School Boards, "The Annual School District Meeting," May 2015
- ↑ 14.0 14.1 14.2 Yes for Oak Creek Schools, "Increased Board Size," accessed July 29, 2015
- ↑ Wisconsin Department of Public Instruction, "Custom Referenda/Resolution Reports," accessed January 27, 2016
- ↑ Eau Claire Area School District, "Meeting Minutes Monday, August 1, 2016," accessed August 13, 2016
- ↑ Eau Claire County, "Unofficial Report: General Election," November 9, 2016
- ↑ 18.0 18.1 Eau Claire Area School District, "Operational Referendum Fact Sheet," accessed August 13, 2016
- ↑ Leader Telegram, "$87.9M referendum OK'd by board," August 2, 2016
- ↑ WEAU, "ECASD referendum set for November ballot as volunteers show their support," August 11, 2016
- ↑ 21.0 21.1 Lake Country Now, "Oconomowoc School Board approves resolution for $54.9 million referendum," August 18, 2016
- ↑ Lake Country Now, "Oconomowoc Schools' $54.9 million referendum passes," November 9, 2016
- ↑ Lake Country Now, "Oconomowoc advisory committee prepares survey on possible referendum," March 17, 2016
- ↑ Oconomowoc Area School District, "Community Survey Results," accessed May 23, 2016
- ↑ 25.0 25.1 Marshfield News Herald, "Should Marshfield schools get more money?" January 7, 2016
- ↑ WSAW, "Marshfield School District passes school referendum," November 8, 2016
- ↑ Douglas County Clerk, "Preliminary Results Presidential & Spring Election April 5, 2016," accessed April 5, 2016
- ↑ 28.0 28.1 Superior Telegram, "Voters to decide construction, renovation of schools," September 1, 2015
- ↑ Superior Telegram, "School Board moves to make referendum official," January 12, 2016
- ↑ Superior Telegram, "School finances explain need for referendum," March 18, 2016
- ↑ 31.0 31.1 United States Department of Education, ED Data Express, "State Tables," accessed May 13, 2014
- ↑ ACT, "2012 ACT National and State Scores," accessed May 13, 2014
- ↑ Commonwealth Foundation, "SAT Scores by State 2013," October 10, 2013
- ↑ StudyPoints, "What's a good SAT score or ACT score?" accessed June 7, 2015
- ↑ United States Department of Education, National Center for Education Statistics, "Common Core of Data (CCD), State Dropout and Graduation Rate Data File, School Year 2010-11, Provision Version 1a and School Year 2011-12, Preliminary Version 1a," accessed May 13, 2014
- ↑ The raw data for this study was provided by Dave Leip of Atlas of U.S. Presidential Elections.
| |||||