Public education in Montana
| K-12 education in Montana | |
 | |
| Education facts | |
| State superintendent: Susie Hedalen | |
| Number of students: 108,894 | |
| Number of teachers: 7,866 | |
| Teacher/pupil ratio: 1:13.8 | |
| Number of school districts: 302 | |
| Number of schools: 684 | |
| Graduation rate: 87% | |
| Per-pupil spending: $12,101 | |
| See also | |
| Montana Department of Education • List of school districts in Montana • Montana • School boards portal | |
Public education in the United States Public education in Montana Glossary of education terms | |
| Note: These statistics are mainly from government sources, including the U.S. Census Bureau and the National Center for Education Statistics. Figures given were the most recent as of October 2022. | |
The Montana public school system (prekindergarten through grade 12) operates within districts governed by locally elected school boards and superintendents. In 2022, Montana had 108,894 students enrolled in a total of 684 schools in 302 school districts. There were 7,866 teachers in the public schools, or roughly one teacher for every 14 students, compared to the national average of 1:16. In 2020, Montana spent on average $12,101 per pupil.[1] The state's graduation rate was 87 percent in the 2018-2019 school year.[2]
General information
- See also: General comparison table for education statistics in the 50 states and Education spending per pupil in all 50 states
The following chart shows how Montana compares to the national level for the most recent years for which data is available.
| Public education in Montana | |||||||
|---|---|---|---|---|---|---|---|
| State | Schools | Districts | Students | Teachers | Teacher to pupil ratio | Per pupil spending* | |
| Montana | 684 | 302 | 108,894 | 7,866 | 1:13.8 | $12,101 | |
| United States | 90,323 | 13,194 | 47,755,383 | 2,783,705 | 1:16 | $13,494 | |
| *Per pupil spending data reflects information reported for fiscal year 2020. Sources: Education statistics in the United States | |||||||
Academic performance
The sections below do not contain the most recently published data on this subject. If you would like to help our coverage grow, consider donating to Ballotpedia.
| Education terms |
|---|
| For more information on education policy terms, see this article. |
NAEP scores
- See also: NAEP scores by state
The National Center for Education Statistics provides state-by-state data on student achievement levels in mathematics and reading in the National Assessment of Educational Progress (NAEP). The table below presents the percentage of fourth and eighth grade students that scored at or above proficient in reading and math during school year 2012-2013. Compared to three neighboring states (North Dakota, South Dakota, and Wyoming), Montana had the highest share of eighth grade students who scored at or above proficient in reading.[3]
| Percent of students scoring at or above proficient, 2012-2013 | ||||
|---|---|---|---|---|
| Math - Grade 4 | Math - Grade 8 | Reading - Grade 4 | Reading - Grade 8 | |
| Montana | 45% | 40% | 35% | 40% |
| North Dakota | 48% | 41% | 34% | 34% |
| South Dakota | 40% | 38% | 32% | 36% |
| Wyoming | 48% | 38% | 37% | 38% |
| United States | 41% | 34% | 34% | 34% |
| Source: United States Department of Education, ED Data Express, "State Tables" | ||||
Graduation, ACT and SAT scores
The following table shows the graduation rates and average composite ACT and SAT scores for Montana and surrounding states during the 2012-2013 school year. All statements made in this section refer to that school year.[3][4][5]
In the United States, public schools reported graduation rates that averaged to about 81.4 percent. About 54 percent of all students in the country took the ACT, while 50 percent reported taking the SAT. The average national composite scores for those tests were 20.9 out of a possible 36 for the ACT, and 1498 out of a possible 2400 for the SAT.[6]
Montana schools reported a graduation rate of 84.4 percent during the 2012-2013 school year, second highest among its neighboring states.
In Montana, more students took the ACT than the SAT in 2013, earning an average ACT score of 21.3.
| Comparison table for graduation rates and test scores, 2012-2013 | |||||||
|---|---|---|---|---|---|---|---|
| State | Graduation rate, 2013 | Average ACT composite, 2013 | Average SAT composite, 2013 | ||||
| Percent | Quintile ranking** | Score | Participation rate | Score | Participation rate | ||
| Montana | 84.4% | Third | 21.3 | 72% | 1595 | 25% | |
| North Dakota | 87.5% | First | 20.5 | 98% | 1799 | 2% | |
| South Dakota | 82.7% | Third | 21.9 | 78% | 1760 | 3% | |
| Wyoming | 77% | Fourth | 19.8 | 100% | 1757 | 4% | |
| United States | 81.4% | 20.9 | 54% | 1498 | 50% | ||
| **Graduation rates for states in the first quintile ranked in the top 20 percent nationally. Similarly, graduation rates for states in the fifth quintile ranked in the bottom 20 percent nationally. Sources: United States Department of Education, "ED Data Express" ACT.org, "2013 ACT National and State Scores" The Commonwealth Foundation, "SAT scores by state, 2013" | |||||||
Dropout rate
- See also: Public high school dropout rates by state for a full comparison of dropout rates by group in all states
The high school event dropout rate indicates the proportion of students who were enrolled at some time during the school year and were expected to be enrolled in grades nine through 12 in the following school year but were not enrolled by October 1 of the following school year. Students who have graduated, transferred to another school, died, moved to another country, or who are out of school due to illness are not considered dropouts. The average public high school event dropout rate for the United States remained constant at 3.3 percent for both school year 2010–2011 and school year 2011–2012. The event dropout rate for Montana was higher than the national average at 4.3 percent in the 2010-2011 school year, and 4.1 percent in the 2011-2012 school year.[7]
Educational choice options
- See also: School choice in Montana
School choice options in Montana included inter-district open enrollment policies and online learning programs. In addition, about 6.46 percent of school-age children in the state attended private schools in the 2011-2012 academic year, and an estimated 2.67 percent were homeschooled in 2012-2013.
Developments
Espinoza v. Montana Department of Revenue (2020)
On June 30, 2020, the U.S. Supreme Court decided Espinoza v. Montana Department of Revenue, which concerned whether the government can exclude religious institutions from student-aid programs. The case related to Article X, Section 6 of the Montana Constitution, also known as Montana’s Blaine Amendment.[8]
In its 5-4 opinion, the court held that the application of Article X, Section 6 violated the free exercise clause of the U.S. Constitution. The majority held Article X, Section 6 barred religious schools and parents who wished to send their children to those schools from receiving public benefits because of the religious character of the school.[9]
The case addressed the tension between the free exercise and Establishment clauses of the U.S. Constitution—where one guarantees the right of individuals' free exercise of religion and the other guarantees that the state won't establish a religion—and the intersections of state constitutions with state law and with the U.S. Constitution.
Montana is one of the states with a Blaine Amendment.
Education funding and expenditures
- See also: Montana state budget and finances
Source: National Association of State Budget Officers
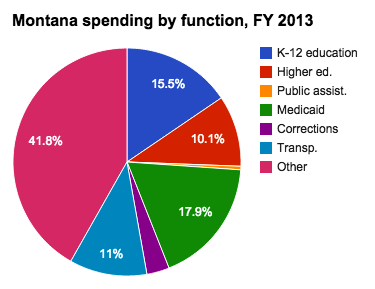
According to the National Association of State Budget Officers (NASBO), states spent an average of 19.8 percent of their total budgets on elementary and secondary education during fiscal year 2013. In addition, the United States Census Bureau found that approximately 45.6 percent of the country's school system revenue came from state sources, while about 45.3 percent came from local sources. The remaining portion of school system revenue came from federal sources.[10][11]
Montana spent approximately 15.5 percent of its budget on elementary and secondary education during fiscal year 2013. School system revenue came primarily from state funds. Montana spent a greater percent of its total budget on public education than any of its neighboring states.
| Comparison of financial figures for school systems, fiscal year 2013 | |||||||
|---|---|---|---|---|---|---|---|
| State | Percentage of budget | Per pupil spending | Revenue sources | ||||
| Percent federal funds | Percent state funds | Percent local funds | |||||
| Montana | 15.5% | $10,625 | 12.8% | 47.7% | 39.5% | ||
| North Dakota | 15% | $11,980 | 10.7% | 50.3% | 38.9% | ||
| South Dakota | 14.1% | $8,470 | 14.8% | 31% | 54.1% | ||
| Wyoming | 10.9% | $15,700 | 6.7% | 52% | 41.3% | ||
| United States | 19.8% | $10,700 | 9.1% | 45.6% | 45.3% | ||
| Sources: NASBO, "State Expenditure Report" (Table 8). U.S. Census Bureau, "Public Education Finances: 2013, Economic Reimbursable Surveys Division Reports" (Table 5 and Table 8). | |||||||
Revenue breakdowns
- See also: Public school system revenues in the U.S. to compare all states.
According to the United States Census Bureau, public school system revenues totaled approximately $598 billion in fiscal year 2013.[11]
In Montana, the primary source of school system revenue was state funding during fiscal year 2013, at $788 million. Montana reported total revenue that was very close to the amounts reported by its neighboring states.
| Revenues by source, fiscal year 2013 (amounts in thousands) | ||||
|---|---|---|---|---|
| State | Federal revenue | State revenue | Local revenue | Total revenue |
| Montana | $210,593 | $788,329 | $652,713 | $1,651,635 |
| North Dakota | $145,905 | $685,348 | $530,337 | $1,361,590 |
| South Dakota | $194,731 | $408,009 | $711,591 | $1,314,331 |
| Wyoming | $113,501 | $881,114 | $698,563 | $1,693,178 |
| United States | $54,367,305 | $272,916,892 | $270,645,402 | $597,929,599 |
| Source: U.S. Census Bureau, "Public Education Finances: 2013, Economic Reimbursable Surveys Division Reports" (Table 1) | ||||
Expenditure breakdowns
According to the National Center for Education Statistics, public school system expenditures totaled approximately $602 billion in fiscal year 2012.[12]
Public education expenditures in Montana totaled approximately $1.7 billion in fiscal year 2012. Montana's total expenditures were nearly equal to Wyoming's, which was the highest when compared to Montana's other neighboring states.
| Expenditures by type, fiscal year 2012 (amounts in thousands) | ||||
|---|---|---|---|---|
| State | General expenditures | Capital outlay | Other | Total expenditures |
| Montana | $1,504,531 | $120,771 | $29,324 | $1,654,625 |
| North Dakota | $1,098,090 | $160,058 | $22,521 | $1,280,669 |
| South Dakota | $1,100,100 | $172,739 | $30,036 | $1,302,875 |
| Wyoming | $1,432,216 | $213,239 | $10,455 | $1,655,911 |
| United States | $527,096,473 | $48,773,386 | $25,897,123 | $601,766,981 |
| Source: National Center for Education Statistics, "Revenues and Expenditures for Public Elementary and Secondary Education: School Year 2011–12 (Fiscal Year 2012)" (Table 5) | ||||
Personnel salaries
According to the National Center for Education Statistics, the average national salary for classroom teachers in public elementary and secondary schools declined by 1.3 percent from the 1999-2000 school year to the 2012-2013 school year. During the same period in Montana, the average salary increased by 13.9 percent.[14]
| Estimated average salaries for teachers (in constant dollars**) | |||||
|---|---|---|---|---|---|
| 1999-2000 | 2009-2010 | 2011-2012 | 2012-2013 | Percent difference | |
| Montana | $43,896 | $48,845 | $49,354 | $49,999 | 13.9% |
| North Dakota | $40,810 | $45,862 | $46,825 | $47,344 | 16% |
| South Dakota | $39,728 | $41,456 | $39,450 | $39,580 | -0.4% |
| Wyoming | $46,638 | $59,628 | $58,174 | $57,920 | 24.2% |
| United States | $57,133 | $58,925 | $56,340 | $56,383 | -1.3% |
| **"Constant dollars based on the Consumer Price Index (CPI), prepared by the Bureau of Labor Statistics, U.S. Department of Labor, adjusted to a school-year basis. The CPI does not account for differences in inflation rates from state to state." | |||||
Organizations
State agencies
- See also: Montana Office of Public Instruction
The Montana Office of Public Instruction is led by the State Superintendent of Public Instruction. Article IV of the Montana Constitution mandates that the Superintendent of Public Instruction be elected to four-year terms. Denise Juneau was first elected to the position in 2008.[15][16]
The Montana Board of Public Education is generally responsible for public education in the state. The board has the following specific responsibilities:[17]
- Adopt standards of accreditation for Montana schools and establish the accreditation status of each school;
- Effect a system of teacher certification, including the accreditation of the teacher and administrator training programs;
- Consider the suspension or revocation of teacher certificates and hear appeals from the denial of teacher certificates;
- Administer and order the distribution of state equalization aid;
- Adopt policies for the special education of handicapped and gifted and talented students; and
- Act as the governing agency for the Montana School for the Deaf and Blind.
The board is composed of eight members, seven of whom are appointed by the governor and confirmed by the state senate. Board members serve seven-year terms. The composition of the board must meet the following requirements:[17]
- No more than four may be from one of the two commission districts
- No more than four may be affiliated with the same political party
One student representative is selected by the Montana Association of Student Councils to serve a one-year term.[17]
Unions
In 2012 the Fordham Institute and Education Reform Now assessed the power and influence of state teacher unions in all 50 states and the District of Columbia. Their rankings were based on 37 different variables in five broad areas: resources and membership, involvement in politics, scope of bargaining, state policies and perceived influence. Montana ranked third overall for union power and influence, or "strongest," which was in the first of five tiers.[18]
The main union related to the Montana school system is the Montana Education Association - Montana Federation of Teachers (MEA-MFT). MEA-MFT is the largest education association in the state. For the 2003 tax period MEA-MFT had: $4.92 million in total revenue, $4.91 million in total expenses and $2.33 million in total assets.[19]
List of local Montana school unions:[20]
- Montana Education Association - Montana Federation of Teachers
- Montana Indian Education Association
- Montana Rural Education Association
- Helena Education Association
- Target Range Teachers Association
Government sector lobbying
- See also: Montana government sector lobbying
The main education government sector lobbying organization is the Montana School Boards Association.
Studies and reports
Quality Counts 2014
- See also: Education Week survey
Education Week, a publication that reports on many education issues throughout the country, began using an evaluation system in 1997 to grade each state on various elements of education performance. This system, called Quality Counts, uses official data on performance from each state to generate report cards for all 50 states and the District of Columbia. The report card in 2014 uses six different categories:
- Chance for success
- K-12 achievement
- Standards, assessments and accountability
- The teaching profession
- School finance
- Transitions and alignment
Each of these six categories had a number of other elements that received individual scores. Those scores were then averaged and used to determine the final score in each category. Every state received two types of scores for each of the six major categories: A numerical score out of 100 and a letter grade based on that score. Education Week used the score for the first category, "chance for success," as the value for ranking each state and the District of Columbia. The average grade received in the entire country was 77.3, or a C+ average. The country's highest average score was in the category of "standards, assessments and accountability" at 85.3, or a B average. The lowest average score was in "K-12 achievement", at 70.2, or a C- average.
Montana received a score of 76.3, or a C average in the "chance for success" category. This was below the national average. The state's highest score was matched with "standards, assessments and accountability" at 76.3, or a C average. This score matched the score in the "chance for success" category. The lowest score was in "transitions and alignment" at 60.7, or a D- average. Montana had the lowest score in the country for "transitions and alignment." The chart below displays the scores of Montana and its surrounding states.[21]
Note: Click on a column heading to sort the data.
| Public education report cards, 2014 | ||||||
|---|---|---|---|---|---|---|
| State | Chance for success | K-12 achievement | Standards, assessments and accountability | The teaching profession | School finance | Transitions and alignment |
| Montana | 76.3 (C) | 69.7 (C-) | 76.3 (C) | 69.4 (D+) | 73.0 (C) | 60.7 (D-) |
| North Dakota | 86.9 (B+) | 68.2 (D+) | 85.4 (B) | 66.6 (D+) | 76.8 (C+) | 78.6 (C+) |
| South Dakota | 79.6 (B-) | 63.2 (D) | 73.0 (C) | 60.8 (D-) | 68.2 (D+) | 64.3 (D) |
| Wyoming | 79.9 (B-) | 70.0 (C-) | 79.3 (C+) | 66.7 (D+) | 90.3 (A-) | 78.6 (C+) |
| United States | 77.3 (C+) | 70.2 (C-) | 85.3 (B) | 72.5 (C) | 75.5 (C) | 81.1 (B-) |
| Source: Education Week, "Quality Counts 2014" A full discussion of how these numbers were generated can be found here. | ||||||
State Budget Solutions education study
State Budget Solutions examined national trends in education from 2009 to 2011, including state-by-state analysis of education spending, graduation rates and average ACT scores. The study showed that the states that spent the most did not have the highest average ACT test scores, nor did they have the highest average graduation rates. A summary of the study is available here. The full report can be accessed here.
School districts
- See also: School board elections portal
District types
Montana contains four types of school districts. Elementary districts educate students in grades K-8. Some elementary districts contain high school districts, which are dependent entities of the elementary district or districts in which they are located. County high school districts are independent entities that educate students in grades 9-12. K-12 districts educate students of all ages. If an elementary district and a high school district have the same boundaries, they are required by law to join together as a K-12 district. Elementary districts and county high school districts can also unify together, although that process requires the passage of a referendum.[22]
School board composition
Montana school board members are elected by residents of the school district. Montana school board elections typically follow the district method. In district elections, only voters residing in a specific geographic area within the school district may vote on certain candidates, who must also reside in that specific geographic area.
The number of board members in an elementary school district depends on the size of the population in the district, along with whether the board has voted to expand its size. Districts with a population of 6,500 or more have seven trustees, districts with a population between 1,000 and 6,500 have five trustees and districts with a population of less than 1,000 have three trustees. The second kind of district can vote to increase its number of trustees from five to seven, and the third kind of district can vote to increase its number of trustees from three to five.
The number of board members in a high school district is dependent on the number of board members in the elementary school district it services, assuming that the high school is located within an elementary school district. If the high school is located in an area with multiple elementary school districts, its number of trustees is dependent on the elementary school district that was established first. The newer elementary school district can petition to increase the size of the high school district's board, or it can be increased by a voter petition to the county superintendent. County high school districts and K-12 districts each have seven trustees.
School board members serve three-year terms, although exceptions are possible.[23]
Term limits
Montana does not impose statewide term limits on school board members.[24]
Elections
- See also: Montana school board elections, 2025
No Montana school districts within Ballotpedia's coverage scope are holding school board elections in 2025.
Our coverage scope for local elections continues to grow, and you can use Ballotpedia's sample ballot tool to see what school board elections we are covering in your area.
Path to the ballot
To qualify for the ballot as a school board candidate in Montana, a person must be:
- A registered voter in the district at the time of the candidacy filing deadline
- A resident of the district
A person must not be:
- Employed by the district
- Running simultaneously for another public office
The process of running for office as a school board candidate begins with filing a "petition of nomination" and an "oath of candidacy." Elementary school district candidates must file petitions with at least 20 signatures, but candidates in other types of school districts are only required to file petitions with a minimum of five signatures. Both the petition and the oath must be filed with the election administrator between 135 and 40 days prior to the election.
To run as a write-in candidate, the candidate must file a "declaration of intent for write-in candidates" form with the election administrator at least 26 days prior to the election. People who receive write-in votes but who did not file that form will still have their votes counted as long as the election is held, they legally qualify to be a candidate and no other candidate has filed for the election. Candidates may withdraw from the ballot if they file a written statement of withdrawal with the district clerk at least 38 days prior to the election.
School board elections are held annually on the first Tuesday after the first Monday in May.[23]
Campaign finance
If a school board candidate, including a write-in candidate, is running in a district with a population over 15,000, or in a county high school district with a population over 2,000 where the candidate has received or spent more than $500, that candidate must file campaign finance reports with the Montana Commissioner of Political Practices. Those reports include a pre-election report and a post-election report, along with a "48 hour report" if a candidate receives a contribution of $100 or more from a single source in the 17 days leading up to the election.[23][25]
Recent legislation
The following is a list of recent education bills that have been introduced in or passed by the Montana state legislature. To learn more about each of these bills, click the bill title. This information is provided by BillTrack50 and LegiScan.
- Note: Due to the nature of the sorting process used to generate this list, some results may not be relevant to the topic. If no bills are displayed below, no legislation pertaining to this topic has been introduced in the legislature recently.
Education ballot measures
- See also: Education on the ballot and List of Montana ballot measures
Ballotpedia has tracked the following statewide ballot measures relating to education.
- Montana University System Tax Levy, LR-118 (2008)
- Montana Department of Education, C-30 (1996)
- Montana University System Tax Levy, LR-113 (1998)
- Montana University of Montana Levy, R-61 (1958)
- Montana Levy for Technical Education, LR-109 (June 1992)
- Montana Bond for Higher Education, Referendum 1 (1908)
- Montana Levy for Education, Referendum 1 (1914)
- Montana Consolidation of Higher Education Institutions, I-9 (1914)
- Montana Levy for University Maintenance, I-18 (1920)
- Montana Bonds for Educational Institutions, I-19 (1920)
- Montana Levy for Public Schools, R-29 (1926)
- Montana Bonds for State Educational Institutions, R-33 (1930)
- Montana State College Bonds, I-44 (1940)
- Montana University of Montana Levy, R-42 (1940)
- Montana State College Bonds, R-45 (1942)
- Montana Educational Bonds, R-46 (1942)
- Montana University of Montana Levy, R-51 (1948)
- Montana University of Montana Bonds, R-52 (1948)
- Montana Training School Bond Issue, R-58 (1954)
- Montana Levy for University Support, R-65 (1968)
- Montana Interest on School Funds, Amendment 2 (1920)
- Montana Qualifications of County Superintendents, Amendment 1 (1924)
- Montana Investment of Public School Permanent Fund, Amendment 2 (1938)
- Montana Create Board of Education, Amendment 1 (1942)
- Montana Income from Public School Funds, Amendment 1 (1944)
- Montana Indebtedness of High School Districts, Amendment 1 (1958)
- Montana Levy to Support University System, LR-75 (1978)
- Montana Levy for Montana University, LR-106 (1988)
- Montana LR-128, Property Tax for State University System Measure (2018)
In the news
The link below is to the most recent stories in a Google news search for the terms Montana education policy. These results are automatically generated from Google. Ballotpedia does not curate or endorse these articles.
See also
- Historical public education information in Montana
- Montana state budget and finances
- Montana Department of Education
- List of school districts in Montana
- Montana
- Education Policy in the U.S.
External links
- Historical public education information in Montana
- Montana Office of Public Instruction
- Montana State Superintendent of Public Instruction
- Montana Board of Public Education
- Montana Advisory Council for Indian Education
Footnotes
- ↑ United States Census Bureau, "U.S. School System Current Spending Per Pupil by Region: Fiscal Year 2020," May 18, 2022
- ↑ National Center for Education Statistics, "Fast Facts: High school graduation rates," accessed September 28, 2022
- ↑ 3.0 3.1 United States Department of Education, ED Data Express, "State Tables," accessed May 13, 2014
- ↑ ACT, "2012 ACT National and State Scores," accessed May 13, 2014
- ↑ Commonwealth Foundation, "SAT Scores by State 2013," October 10, 2013
- ↑ StudyPoints, "What's a good SAT score or ACT score?" accessed June 7, 2015
- ↑ United States Department of Education, National Center for Education Statistics, "Common Core of Data (CCD), State Dropout and Graduation Rate Data File, School Year 2010-11, Provision Version 1a and School Year 2011-12, Preliminary Version 1a," accessed May 13, 2014
- ↑ Supreme Court of the United States, Espinoza v. Montana Department of Revenue: "Petition for a writ of certiorari," accessed July 3, 2019
- ↑ Supreme Court of the United States, Espinoza v. Montana Department of Revenue, decided June 30, 2020
- ↑ NASBO, "State Expenditure Report," accessed July 2, 2015
- ↑ 11.0 11.1 U.S. Census Bureau, "Public Education Finances: 2013, Economic Reimbursable Surveys Division Reports," accessed July 2, 2015
- ↑ National Center for Education Statistics, "Revenues and Expenditures for Public Elementary and Secondary Education: School Year 2011–12 (Fiscal Year 2012)," accessed July 2, 2015
- ↑ Maciver Institute, "REPORT: How much are teachers really paid?" accessed October 29, 2014
- ↑ United States Department of Education, National Center for Education Statistics, "Table 211.60. Estimated average annual salary of teachers in public elementary and secondary schools, by state: Selected years, 1969-70 through 2012-13," accessed May 13, 2014
- ↑ The Constitution of the State of Montana, "Article IV," accessed May 22, 2014
- ↑ Montana Office of Public Instruction, "State Superintendent of Public Instruction," accessed May 22, 2014
- ↑ 17.0 17.1 17.2 Montana Board of Public Education, "About Us," accessed May 22, 2014
- ↑ Thomas E Fordham Institute, " How Strong Are U.S. Teacher Unions? A State-By-State Comparison," October 29, 2012
- ↑ Center for Union Facts, "Montana Education Association - Montana Federation of Teachers," accessed November 10, 2009
- ↑ Center for Union Facts, "Montana teachers unions," accessed November 10, 2009
- ↑ Education Week "Quality Counts 2014," accessed February 19, 2015
- ↑ United States Census Bureau, "Montana," accessed July 10, 2014
- ↑ 23.0 23.1 23.2 Montana Office of Public Instruction, "School Election Handbook," accessed July 10, 2014
- ↑ National School Boards Association, "Survey of the State School Boards Associations on Term Limits for Local Board Members," accessed July 8, 2014
- ↑ Montana Commissioner of Political Practices, "Campaign Finance Report Calendar for School Trustee Candidates," accessed July 10, 2014