Presidential campaign pageviews following caucuses and primaries, 2020
Date: November 3, 2020 |
Candidates on the issues • Battleground states • Electoral College • Pivot Counties |
September 29 debate • October 7 debate • October 15 debate • October 22 debate • Democratic debates |
Democratic • Republican • Libertarian • Green • Constitution |
2028 • 2024 • 2020 • 2016 |
Long before candidates such as Donald Trump (R) and Alexandria Ocasio-Cortez (D) won elections, they bested their opponents in pageviews on Ballotpedia.
Like other websites, Ballotpedia's servers count how many times each page is visited. These pageview statistics indicate readers' relative interest in the page's subject. This page serves as a hub for publication and analysis of pageview statistics for 2020 presidential campaign pages.
Our objective in publishing these figures is to provide readers with the same information that we have on the levels of interest that 2020 presidential candidates are drawing. We hope that you will enjoy exploring and finding trends in the data.
Visiting a page is not an endorsement of a candidate, so pageviews should not be equated with support. Readers come to a campaign page because they think the candidate is worth knowing more about, whether the reader believes the candidate has a strong chance of winning or is an unknown who warrants a closer look. The following statistics reflect the time investments of our community of thousands of readers.
Pageview statistics are only collected in the aggregate; in other words, we count the number of visitors a given page receives but not information such as what other pages a particular reader visits.
First published: February 12, 2020.
Last update: February 24, 2020.
On this page, you will find:
- Analysis of the significance of candidate pageviews on Ballotpedia.
- Things to keep in mind about the limitations of pageview data.
- A look at pageviews in past elections
- Pageviews following the Iowa Democratic caucuses
List of presidential campaign pages
|
- See also: Presidential candidates, 2020
The pageview information presented here covers the pages for each notable presidential candidate's campaign page on Ballotpedia. Links to each of the pages included in these figures are below.
- Donald Trump (R) and Mike Pence (R)
- Joe Biden (D) and Kamala Harris (D)
- Howie Hawkins (G) and Angela Nicole Walker (G)
- Jo Jorgensen (L) and Spike Cohen (L)
What pageviews can tell us
Pageview jumps might indicate that a candidate is about to break out in their race. For instance, during the 2016 presidential campaign, Bernie Sanders' Ballotpedia page climbed in pageviews ahead of Sanders' gaining in the polls. Sanders' pageviews on Ballotpedia tended to increase as Google searches for Sanders increased, with Ballotpedia pageviews rising and falling a few weeks after Google searches did. The chart below shows Sanders' relative performance in Google trends and Ballotpedia pageviews between the end of March 2015 and the end of July 2016. Both figures are normalized, with 100 indicating Sanders' relative peak in pageviews and in searches during the period.
We have observed a similar trend in some congressional races. In the Democratic primary for Texas' 7th congressional district in 2018, activist Laura Moser's (D) candidate page notched an increase in pageviews before Moser, who had been third in fundraising and lagged in polling, became the target of a Democratic Congressional Campaign Committee opposition research release. Following the release, Moser spiked in Google searches and performed well enough on election day to make her way into a runoff. For more examples of pageview spikes in past elections, click here.
What to keep in mind when looking at pageviews
It's important to remember the audience that might drive pageviews in different stages of an election. Pageview statistics 17 months out from a presidential election (this was originally published in June 2019) are not necessarily capturing traffic from the average voter. Voters who are particularly interested in politics and following events closely are likely overrepresented in early statistics relative to pageview statistics for September 2020.
Another caveat are the limitations that come from measuring pageviews from a single source. Most of the traffic on our campaign pages comes from Google searches for a particular candidate, meaning that Ballotpedia's placement in search rankings can impact the traffic a candidate receives. Campaign pages for candidates that receive more coverage outside of Ballotpedia, such as Joe Biden and Donald Trump, may receive fewer pageviews compared to candidates who receive less coverage.
Well-known candidates might also receive fewer pageviews due to name recognition. Our comparison of pageview stats and polling data shows that candidates who perform better in the polls receive fewer pageviews relative to their poll performance. In other words, as a candidate grows more popular, their pageviews tend to not increase at the same rate.
These statistics also do not account for one-off jumps in pageviews. For instance, a media source might include a link to a Ballotpedia presidential campaign page in their coverage of that candidate. A campaign might even encourage supporters to read up on Ballotpedia and win their candidate more pageviews. We provide these statistics exactly as they are, meaning that these week-to-week spikes could be impactful.
All of this is to say that this is a new concept. The jury remains out as to just how significant polls or endorsements are in assessing a presidential race, and that's with the benefit of decades of historical data to inform the debate. It could be the case that pageviews are not a useful indicator of which candidate might win an election, but at the very least they seem to provide a glimpse at the relative level of interest a given candidate can generate.
Pageview stats versus polling data
It may be tempting to compare pageview statistics with polling -- after all, both are numerical measures of interest in a candidate. There are notable differences between the two, however. Polls offer an imperfect snapshot in time that evaluates support for a given candidate based on extrapolation from conversations with a random and representative sample of the voting public. In contrast, pageview statistics provide a complete sample (not an extrapolation) of how many readers are interested in a given candidate based on a non-random, non-representative sample of voters. A reader who visits a candidate's page is not necessarily a supporter of that candidate; pageviews might instead be thought of as a measure of how curious voters are about a given candidate.
The chart below compares average weekly polling results to overall share of presidential pageviews for Democratic candidates between the week ending March 30 and the week ending May 25. The ten selected candidates each averaged at least 1% support across all nine weeks. For instance, during the week ending in April 6, Julián Castro received a 4.69% share of pageviews for each 1% in polls—in other words, his pageview performance was nearly five times his performance in the polls.
If a correlation existed between a candidate's standing in the polls and their presidential pageviews, we would expect a flat horizontal line. While candidates who performed well in these polls (such as Joe Biden and Bernie Sanders) do have more consistent performance, they tend to stay below 1% of pageviews for each 1% of polling—in other words, they underperform in Ballotpedia pageviews relative to their performance in the polls. Candidates who did not perform as well in polling (such as Julián Castro and Amy Klobuchar) tend to perform far better in pageviews but also experience greater variance from week-to-week.
A candidate who demonstrated both trends is Pete Buttigieg. Buttigieg's lowest performance in the polls was during the week ending in March 30, when he averaged 2.25% in polling and led all Democratic candidates in pageviews, outperforming his polling by a factor of 4.7x. As Buttigieg climbed in the polls, his relative stance in pageviews did not increase at the same rate. From the week ending in April 27 on, Buttigieg was among the top five Democratic candidates in polling, averaging between 8.5% and 5.75%. He outperformed pageviews by a lower margin, staying between 1.19x and 1.66x for the entire duration.
Historical case studies
2016: Donald Trump (R)
- See also: Donald Trump presidential campaign, 2016
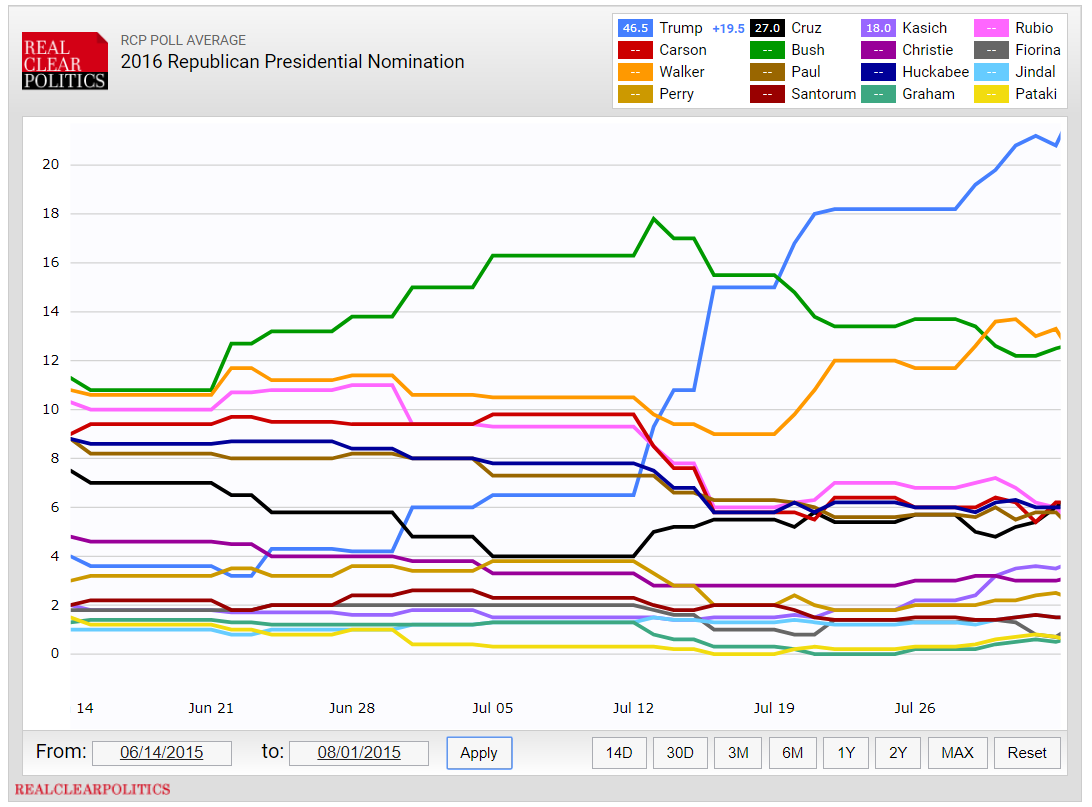
During the Republican presidential primary in the 2016 cycle, Ballotpedia's page on President Donald Trump's (R) campaign outperformed polling data ahead of his taking first place in the polls. Trump launched his campaign on June 16, 2015. According to the below RealClearPolitics overview of polls, Trump (represented by the blue line) was polling at approximately 4% at the start of his campaign, putting him in ninth place among Republican presidential candidates. He surpassed Gov. Jeb Bush (R) (represented by the green line) in polling to take first place on July 19, 2015.
The following graph shows Ballotpedia pageviews for Republican presidential candidates over the same period. President Trump is represented by the dotted line, while Gov. Bush is represented by the dashed line. Trump surpassed Bush in pageviews during the week ending July 18, 2015, which is broadly in line with polls showing him taking the lead on July 19. However, President Trump's campaign page, which we launched June 16, was the second-most viewed campaign page for the week ending June 20 despite being launched partway through the week. President Trump continued to stay in second place until surpassing Bush, with neurosurgeon Ben Carson (R) placing third.
2018: Alexandria Ocasio-Cortez (D)
While President Trump received substantial media attention in between his announcement and taking the lead in the polls, the same cannot be said for Alexandria Ocasio-Cortez (D), who defeated Rep. Joseph Crowley (D) (at the time the fourth-ranked House Democrat) in the 2018 primary in New York's 14th Congressional District. The New York Times characterized the result as "the most significant loss for a Democratic incumbent in more than a decade," and referred to earlier media coverage of the race which had not even mentioned Ocasio-Cortez's name.[1] However, Ocasio-Cortez generated more pageviews than Crowley throughout the course of the campaign. The following chart shows relative pageviews for Ocasio-Cortez and Crowley's Ballotpedia profile pages from the week of July 1, 2017 (when Ocasio-Cortez's page was published) through the week before the June 26, 2018, primary. It shows four distinct jumps in Ocasio-Cortez's pageviews in 2017 and early 2018 and none for Crowley. Ocasio-Cortez surpassed Crowley in pageviews around March 17 with the gap widening substantially by the week before the election.
2014: David Ige (D)
- See also: Hawaii gubernatorial election, 2014
In Hawaii's 2014 gubernatorial election, state Sen. David Ige (D) defeated incumbent Neil Abercrombie (D) in the Democratic primary. It was the first primary defeat of an incumbent governor in Hawaii history. As of the 2020 presidential election, it is also the most recent case where an elected governor was defeated in a primary. The following chart shows Ige and Abercrombie's pageviews for the twelve weeks preceding the election. While the two began the period with similar pageviews, Ige pulled ahead in the first week of July and, as in Ocasio-Cortez's case, continued to lead Abercrombie in the weeks immediately preceding the election.
Pageviews following the Iowa Democratic caucuses
The Democratic Iowa caucuses were held on February 3, 2020. The Iowa Democratic Party delayed releasing the caucus results due to quality control issues. The state party released results from 62 percent of precincts on February 4, 2020, showing former Mayor Pete Buttigieg leading in state delegate equivalents and Sen. Bernie Sanders leading in the final raw vote.[2]
During this three-day period, every candidate other than Pete Buttigieg had the most pageviews the day of the caucuses. Buttigieg had the most pageviews the day after the caucuses. Each of the three largest day-over-day pageview jumps occurred between the day before the caucuses and the day of the caucuses. Elizabeth Warren's pageviews jumped by 67.45% during this time, followed by Joe Biden (67.05%) and Tulsi Gabbard (66.67%). The largest single-day pageview figure was 1,457 pageviews for Bernie Sanders on the day of the caucuses, followed by 1,417 pageviews for Buttigieg on the day after the caucuses, and 1,126 for Joe Biden on the day of the caucuses.
During this period, the top five Democratic candidates by pageviews were:
- Bernie Sanders (16.10% of all Democratic candidate pageviews)
- Pete Buttigieg (14.16%)
- Joe Biden (12.52%)
- Michael Bloomberg (12.31%)
- Andrew Yang (8.89%)
For comparison, during the week before the caucuses, the top five Democratic candidates by pageviews were:
- Bernie Sanders (15.76% of all Democratic candidate pageviews)
- Michael Bloomberg (13.48%)
- Joe Biden (13.10%)
- Andrew Yang (10.14%)
- Pete Buttigieg (8.58%)
Pageviews following the New Hampshire Democratic primary
The Democratic New Hampshire primary was held on February 10, 2020. Sen. Bernie Sanders (I-Vt.) won the Democratic primary with approximately 26% of the vote. Sanders and second-place finisher, former South Bend Mayor Pete Buttigieg, were each projected to win 9 pledged delegates. Sen. Amy Klobuchar came in third with a projected 6 pledged delegates.[3]
During this three-day period, every candidate other than Joe Biden had the most pageviews the day of the primary. Biden had the most pageviews the day after the primary. Each of the three largest day-over-day pageview jumps occurred between the day before the primary and the day of the primary. Deval Patrick's pageviews jumped by 46.73% during this time, followed by Amy Klobuchar (44.77%) and Michael Bloomberg (40.42%). The largest single-day pageview figure was 2,061 pageviews for Bloomberg, followed by 1,761 pageviews for Pete Buttigieg and 1,604 for Bernie Sanders all on the day of the primary.
During this period, the top five Democratic candidates by pageviews were:
- Michael Bloomberg (19.05% of all Democratic candidate pageviews)
- Pete Buttigieg (16.93%)
- Bernie Sanders (15.89%)
- Amy Klobuchar (12.21%)
- Joe Biden (10.39%)
For comparison, during the week before the primary, the top five Democratic candidates by pageviews were:
- Pete Buttigieg (19.09% of all Democratic candidate pageviews)
- Bernie Sanders (15.10%)
- Michael Bloomberg (12.86%)
- Joe Biden (10.73%)
- Andrew Yang (7.90%)
Pageviews following the Nevada Democratic caucuses
- See also: Presidential election in Nevada, 2020
The Democratic Nevada caucuses were held on February 22, 2020. With 88% of precincts reporting on February 24, Sen. Bernie Sanders (I-Vt.) led with 47% of the county convention delegates. Former Vice President Joe Biden had 21% of the county convention delegates and former South Bend Mayor Pete Buttigieg had 14% of the county convention delegates.[4]
During this three-day period, six of the candidates had the most pageviews the day before the caucuses. Former New York City Mayor Michael Bloomberg had the most pageviews the day of the caucuses. Sanders had the most pageviews the day after the caucuses. Sanders had two of the three largest day-over-day pageview jumps: from the day before to the day of the caucuses (29.35%) and from the day of the caucuses to the day after the caucuses (19.88%). Biden's pageviews increased 20.09% from the day of the caucuses to the day after the caucuses. Sanders' pageviews each day account for the three largest single-day pageviews at 1,680 (the day after caucuses), 1,346 (day of caucuses), and 951 (the day before caucuses).
During this period, the top five Democratic candidates by pageviews were:
- Bernie Sanders (29.27% of all Democratic candidate pageviews)
- Michael Bloomberg (14.83%)
- Joe Biden (14.30%)
- Pete Buttigieg (13.29%)
- Elizabeth Warren (10.18%)
For comparison, during the week before the primary, the top five Democratic candidates by pageviews were:
- Michael Bloomberg (21.22% of all Democratic candidate pageviews)
- Pete Buttigieg (18.57%)
- Bernie Sanders (18.28%)
- Amy Klobuchar (12.51%)
- Joe Biden (11.89%)
See also
- Presidential election, 2020
- Presidential candidates, 2020
- Timeline of announcements in the presidential election, 2020
- Democratic presidential nomination, 2020
- Republican presidential nomination, 2020
- Presidential election endorsements, 2020
Footnotes
- ↑ The New York Times, "Alexandria Ocasio-Cortez Defeats Joseph Crowley in Major Democratic House Upset," June 26, 2018
- ↑ CNN, "Iowa Results," February 4, 2020
- ↑ The New York Times, "New Hampshire 2020 Primary: Live Results," February 11, 2020
- ↑ AP News, "Sanders wins Nevada caucuses, takes national Democratic lead," February 22, 2020
| |||||||||||