Missouri school board elections, 2016
← 2015 |
2017 →
|
Elections
General elections for Missouri school boards were held April 5, 2016. There were no primary or runoff elections. Special elections for unexpired board terms were held in conjunction with the general election cycle. Nineteen Missouri school districts among America's largest school districts by enrollment in the 2013–2014 school year held elections in 2016.
Here are several quick facts about Missouri's school board elections in 2016:
- The largest school district by enrollment with an election in 2016 was Springfield Public Schools with 25,545 K-12 students.
- The smallest Missouri school district among the nation's top 1,000 largest with an election in 2016 was Mehlville School District with 10,537 K-12 students.
- Kansas City Public Schools had the most seats up for election in 2016 with four seats on the ballot.
- The other 18 districts tied for fewest seats up for election in 2016 with two seats on the ballot each.
The district listed below served 306,069 K-12 students during the 2013-2014 school year, according to the National Center for Education Statistics. Click on the district name for more information on the district and its school board elections.
| 2016 Missouri School Board Elections | |||||||
|---|---|---|---|---|---|---|---|
| District | General date | Regular term (years) | Seats up for election | Total board seats | Student enrollment | ||
| Blue Springs School District | 4/5/2016 | 3 | 2 | 7 | 14,382 | ||
| Columbia Public Schools | 4/5/2016 | 3 | 2 | 7 | 17,872 | ||
| Ferguson-Florissant School District | 4/5/2016 | 3 | 2 | 7 | 12,056 | ||
| Fort Zumwalt R-II School District | 4/5/2016 | 3 | 2 | 7 | 18,654 | ||
| Fox C-6 School District | 4/5/2016 | 3 | 2 | 7 | 11,682 | ||
| Francis Howell School District | 4/5/2016 | 3 | 2 | 7 | 19,975 | ||
| Hazelwood School District | 4/5/2016 | 3 | 2 | 7 | 18,402 | ||
| Independence School District | 4/5/2016 | 6 | 2 | 7 | 14,856 | ||
| Kansas City Public Schools | 4/5/2016 | 4 | 4 | 9 | 15,230 | ||
| Lee's Summit R-7 Schools | 4/5/2016 | 3 | 2 | 7 | 17,844 | ||
| Liberty Public Schools | 4/5/2016 | 3 | 2 | 7 | 11,821 | ||
| Mehlville School District | 4/5/2016 | 3 | 2 | 7 | 11,060 | ||
| North Kansas City Schools | 4/5/2016 | 3 | 2 | 7 | 19,726 | ||
| Park Hill School District | 4/5/2016 | 3 | 2 | 7 | 10,631 | ||
| Parkway Schools | 4/5/2016 | 3 | 2 | 7 | 17,955 | ||
| Rockwood School District | 4/5/2016 | 3 | 2 | 7 | 21,883 | ||
| Springfield Public Schools | 4/5/2016 | 3 | 3 | 7 | 25,609 | ||
| St. Joseph School District | 4/5/2016 | 6 | 2 | 7 | 11,882 | ||
| Wentzville R-IV School District | 4/5/2016 | 3 | 3 | 7 | 14,549 | ||
Election trends
Trends in Missouri school board elections

- See also: School boards in session: 2015 in brief
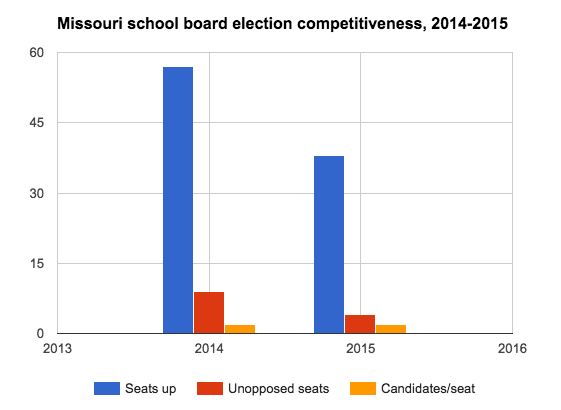
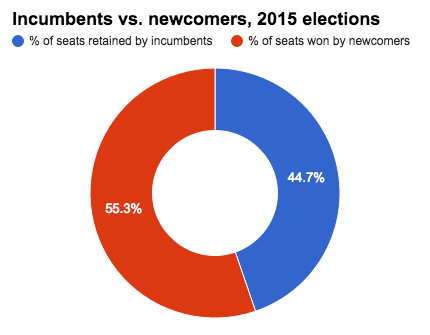
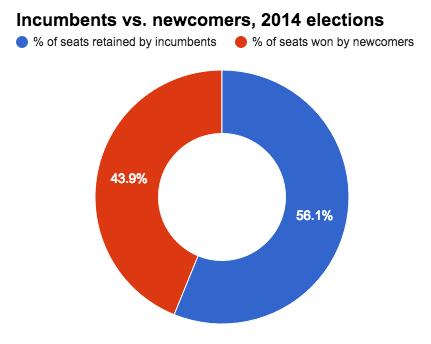
The 2015 school board elections held in Missouri's largest school districts saw more candidates run per seat on the ballot compared to the state's 2014 school board elections. The 2015 elections also had fewer unopposed seats compared to 2014. Newcomers fared better in 2015 than in 2014. They won 55.26 percent of seats on the ballot in 2015, compared to 43.86 percent in 2014.
The following sections analyze competitiveness and incumbency advantage in Missouri's school board elections. These districts did not utilize primary or runoff elections. Winners only had to receive a plurality, or relative majority, of votes to secure a seat. All of the school board elections held in the state in 2014 and 2015 were nonpartisan.
Details of the data discussed here can be found in the table below.
Competitiveness
In 2015, Missouri's largest school district elections garnered an average of 1.92 candidates per seat up for election. This was an increase from the state's average of 1.86 candidates per seat in the 2014 elections. The state's 2015 school board elections also had a smaller percentage of unopposed seats than it had in 2014. A total of 10.53 percent of seats attracted no opposition in 2015, compared to 15.79 percent in the state's 2014 elections.
Incumbency advantage
|
A total of 73.91 percent of incumbents who ran to retain their seats won re-election in 2015. Twenty-three of the 38 incumbents whose seats were on the ballot ran to keep their seats, and 17 of them won. Two of those winners ran unopposed; the other 15 defeated challengers to win additional terms. In 2014, 85.71 percent of incumbents who ran for re-election retained their seats. A total of 37 of the 57 incumbents who were up for re-election ran to keep their seats, and 32 of them were re-elected. Eight of those winners ran unopposed; the other 24 defeated challengers to keep their seats. The map below details the success rates for incumbents who ran in the 2015 school board elections that were held in the largest school districts by enrollment in the U.S.
|
  |
Data table
| Missouri school board elections, 2014 - 2015 | ||||||||||
|---|---|---|---|---|---|---|---|---|---|---|
| 2014 | 2015 | |||||||||
| All candidates | ||||||||||
| Seats up | 57 | 38 | ||||||||
| Candidates | 106 | 73 | ||||||||
| Candidates/seat | 1.86 | 1.92 | ||||||||
| Unopposed seats | 9 | 4 | ||||||||
| % unopposed | 15.79% | 10.53% | ||||||||
| % seats won by newcomers | 43.86% | 55.26% | ||||||||
| Incumbents | ||||||||||
| Sought re-election | 37 | 23 | ||||||||
| Unopposed | 8 | 2 | ||||||||
| Retained | 32 | 17 | ||||||||
| % retained | 85.71% | 73.91% | ||||||||
Academic performance
- See also: Public education in Missouri
The sections below do not contain the most recently published data on this subject. If you would like to help our coverage grow, consider donating to Ballotpedia.
| Education terms |
|---|
| For more information on education policy terms, see this article. |
NAEP scores
- See also: NAEP scores by state
The National Center for Education Statistics provides state-by-state data on student achievement levels in mathematics and reading in the National Assessment of Educational Progress (NAEP). The table below presents the percentage of fourth and eighth grade students that scored at or above proficient in reading and math during school year 2012-2013. Students in Missouri scored about the same as those in Arkansas and Illinois, but slightly lower than students in Iowa. The best scores in the state were earned by fourth graders in math, with 39 percent scoring at or above proficient.[1]
| Percent of students scoring at or above proficient, 2012-2013 | ||||
|---|---|---|---|---|
| Math - Grade 4 | Math - Grade 8 | Reading - Grade 4 | Reading - Grade 8 | |
| Missouri | 39% | 33% | 35% | 36% |
| Arkansas | 39% | 28% | 32% | 30% |
| Illinois | 39% | 36% | 34% | 36% |
| Iowa | 48% | 36% | 38% | 37% |
| United States | 41% | 34% | 34% | 34% |
| Source: United States Department of Education, ED Data Express, "State Tables" | ||||
Graduation, ACT and SAT scores
The following table shows the graduation rates and average composite ACT and SAT scores for Missouri and surrounding states during the 2012-2013 school year. All statements made in this section refer to that school year.[1][2][3]
In the United States, public schools reported graduation rates that averaged to about 81.4 percent. About 54 percent of all students in the country took the ACT, while 50 percent reported taking the SAT. The average national composite scores for those tests were 20.9 out of a possible 36 for the ACT, and 1498 out of a possible 2400 for the SAT.[4]
Missouri schools reported a graduation rate of 85.7 percent during the 2012-2013 school year, second highest among its neighboring states.
In Missouri, more students took the ACT than the SAT in 2013, earning an average ACT score of 21.6.
| Comparison table for graduation rates and test scores, 2012-2013 | |||||||
|---|---|---|---|---|---|---|---|
| State | Graduation rate, 2013 | Average ACT composite, 2013 | Average SAT composite, 2013 | ||||
| Percent | Quintile ranking** | Score | Participation rate | Score | Participation rate | ||
| Missouri | 85.7% | Second | 21.6 | 74% | 1773 | 4% | |
| Arkansas | 84.9% | Second | 20.2 | 90% | 1697 | 4% | |
| Illinois | 83.2% | Third | 20.6 | 100% | 1807 | 5% | |
| Iowa | 89.7% | First | 22.1 | 66% | 1763 | 3% | |
| United States | 81.4% | 20.9 | 54% | 1498 | 50% | ||
| **Graduation rates for states in the first quintile ranked in the top 20 percent nationally. Similarly, graduation rates for states in the fifth quintile ranked in the bottom 20 percent nationally. Sources: United States Department of Education, "ED Data Express" ACT.org, "2013 ACT National and State Scores" The Commonwealth Foundation, "SAT scores by state, 2013" | |||||||
Dropout rate
- See also: Public high school dropout rates by state for a full comparison of dropout rates by group in all states
The high school event dropout rate indicates the proportion of students who were enrolled at some time during the school year and were expected to be enrolled in grades nine through 12 in the following school year but were not enrolled by October 1 of the following school year. Students who have graduated, transferred to another school, died, moved to another country, or who are out of school due to illness are not considered dropouts. The average public high school event dropout rate for the United States remained constant at 3.3 percent for both school year 2010–2011 and school year 2011–2012. The event dropout rate for Missouri was higher than the national average at 3.4 percent in the 2010-2011 school year. The dropout rate was lower than the national average at 2.9 percent in the 2011-2012 school year.[5]
State profile
State profile
| Demographic data for Missouri | ||
|---|---|---|
| Missouri | U.S. | |
| Total population: | 6,076,204 | 316,515,021 |
| Land area (sq mi): | 68,742 | 3,531,905 |
| Race and ethnicity** | ||
| White: | 82.6% | 73.6% |
| Black/African American: | 11.5% | 12.6% |
| Asian: | 1.8% | 5.1% |
| Native American: | 0.4% | 0.8% |
| Pacific Islander: | 0.1% | 0.2% |
| Two or more: | 2.4% | 3% |
| Hispanic/Latino: | 3.9% | 17.1% |
| Education | ||
| High school graduation rate: | 88.4% | 86.7% |
| College graduation rate: | 27.1% | 29.8% |
| Income | ||
| Median household income: | $48,173 | $53,889 |
| Persons below poverty level: | 18.2% | 11.3% |
| Source: U.S. Census Bureau, "American Community Survey" (5-year estimates 2010-2015) Click here for more information on the 2020 census and here for more on its impact on the redistricting process in Missouri. **Note: Percentages for race and ethnicity may add up to more than 100 percent because respondents may report more than one race and the Hispanic/Latino ethnicity may be selected in conjunction with any race. Read more about race and ethnicity in the census here. | ||
Presidential voting pattern
- See also: Presidential voting trends in Missouri
Missouri voted Republican in all seven presidential elections between 2000 and 2024.
More Missouri coverage on Ballotpedia
- Elections in Missouri
- United States congressional delegations from Missouri
- Public policy in Missouri
- Endorsers in Missouri
- Missouri fact checks
- More...
See also
| Missouri | School Boards | News and Analysis |
|---|---|---|
 |
 | |
Footnotes
- ↑ 1.0 1.1 United States Department of Education, ED Data Express, "State Tables," accessed May 13, 2014
- ↑ ACT, "2012 ACT National and State Scores," accessed May 13, 2014
- ↑ Commonwealth Foundation, "SAT Scores by State 2013," October 10, 2013
- ↑ StudyPoints, "What's a good SAT score or ACT score?" accessed June 7, 2015
- ↑ United States Department of Education, National Center for Education Statistics, "Common Core of Data (CCD), State Dropout and Graduation Rate Data File, School Year 2010-11, Provision Version 1a and School Year 2011-12, Preliminary Version 1a," accessed May 13, 2014
| |||||