Higher education in New York, 1993-2016
This article does not contain the most recently published data on this subject. If you would like to help our coverage grow, consider donating to Ballotpedia.
| Higher education |
|---|
| Tuition statistics |
| Financial aid statistics |
| Retention rates |
| Graduation rates |
| Higher education funding |
New York's higher education system is composed of 309 colleges and universities. Of these, 81 are public institutions, 184 are nonprofit private schools, and 44 are for-profit private institutions.[1]
Higher education policy decisions can affect college access, the retention of students and the eventual completion of their degrees, student rights on campus, students' financial burden in the form of debt, and their employment prospects after graduation. Click on the tabs below to learn more about higher education in New York.
Overview
| Overview | |
| Total number of schools: 309 | |
| Public schools: 81 | |
| State agency: New York State Higher Education Services Corporation | |
| Retention rate: 75%[2] | |
| Graduation rate: 59.2%[3] | |
| Average public in-state tuition: $6,892 | |
| Total funding for public higher education: $5,466,691,712 | |
| Funding per full-time student: $8,454 | |
| Higher education in the United States • Education policy • Education policy in the United States • Public education in New York | |
Overview
Higher education policy refers to the decisions made by the federal government, state legislatures, higher education boards, and colleges and universities themselves. These decisions can affect how state funding is allocated, who sets tuition and at what level, campus resources available for academically struggling students, degrees and programs offered, and state financial aid eligibility and award amounts, as some examples. Higher education entities also set policies that manage campus environments, such as the prohibition or allowance of guns on campus and rules regarding free speech and student protests.[4]
Generally speaking, there are four types of postsecondary educational institutions in the United States:[5][6]
- Public two-year institutions, which are most commonly known as community colleges, typically "award associate degrees in vocational fields [and] prepare students for transfer to four-year institutions." These schools are financed in large part with public funds. Dutchess Community College is an example of a public two-year institution in New York.[5][6]
- Public four-year colleges and universities award baccalaureate and/or graduate degrees. Traditionally, a distinction has been made between colleges and universities, with colleges awarding only four-year degrees and universities awarding both four-year and graduate-level degrees; however, these two terms are often used interchangeably today. Like their two-year counterparts, public four-year colleges and universities are financed largely with public funds. The State University of New York and Morrisville State College are examples of public four-year institutions in New York.[5][6]
- Private nonprofit institutions can vary dramatically in size, course offerings, and mission. These institutions do not receive public funding directly. Instead, private nonprofit schools are financed primarily by tuition, gifts, and endowments. These schools do not generate profit. Alfred University and Roberts Wesleyan College are examples of private nonprofit institutions in New York.[5][6]
- Private for-profit institutions typically specialize in vocational education. Like their nonprofit counterparts, these schools do not receive public funds. These mainly online universities generally serve older students and endeavor to generate profits. Examples in New York include DeVry College of New York and Bryan and Stratton College.[5][6]
The oldest postsecondary school in New York is Columbia University, a private university. Founded in 1754, the school remains open as of January 2015. It is located in Manhattan in New York City and enrolled about 6,080 students in the 2014-2015 school year.[7]
As of July 2016, there were 81 public colleges and universities in New York, according to the National Center for Education Statistics. These are listed in the table below.[1]
| Public postsecondary institutions in New York | |
|---|---|
| School | Type |
| Adirondack Community College | Two-year |
| Buffalo State SUNY | Four-year |
| Cayuga County Community College | Two-year |
| Clinton Community College | Two-year |
| College of Staten Island CUNY | Four-year |
| Columbia-Greene Community College | Two-year |
| Corning Community College | Two-year |
| CUNY Bernard M Baruch College | Four-year |
| CUNY Borough of Manhattan Community College | Two-year |
| CUNY Bronx Community College | Two-year |
| CUNY Brooklyn College | Four-year |
| CUNY City College | Four-year |
| CUNY Graduate School and University Center | Four-year |
| CUNY Hostos Community College | Two-year |
| CUNY Hunter College | Four-year |
| CUNY John Jay College of Criminal Justice | Four-year |
| CUNY Kingsborough Community College | Two-year |
| CUNY LaGuardia Community College | Two-year |
| CUNY Lehman College | Four-year |
| CUNY Medgar Evers College | Four-year, primarily associate's |
| CUNY New York City College of Technology | Four-year, primarily associate's |
| CUNY Queens College | Four-year |
| CUNY Queensborough Community College | Two-year |
| CUNY School of Law at Queens College | Four-year |
| CUNY York College | Four-year |
| Dutchess Community College | Two-year |
| Erie Community College | Two-year |
| Farmingdale State College | Four-year |
| Fashion Institute of Technology | Four-year, primarily associate's |
| Finger Lakes Community College | Two-year |
| Fulton-Montgomery Community College | Two-year |
| Genesee Community College | Two-year |
| Herkimer County Community College | Two-year |
| Hudson Valley Community College | Two-year |
| Jamestown Community College | Two-year |
| Jefferson Community College | Two-year |
| Mohawk Valley Community College | Two-year |
| Monroe Community College | Two-year |
| Morrisville State College | Four-year, primarily associate's |
| Nassau Community College | Two-year |
| Niagara County Community College | Two-year |
| North Country Community College | Two-year |
| Onondaga Community College | Two-year |
| Orange County Community College | Two-year |
| Rockland Community College | Two-year |
| Schenectady County Community College | Two-year |
| State University of New York at New Paltz | Four-year |
| Stella and Charles Guttman Community College | Two-year |
| Stony Brook University | Four-year |
| Suffolk County Community College | Two-year |
| Sullivan County Community College | Two-year |
| SUNY at Albany | Four-year |
| SUNY at Binghamton | Four-year |
| SUNY at Fredonia | Four-year |
| SUNY at Purchase College | Four-year |
| SUNY Broome Community College | Two-year |
| SUNY College at Brockport | Four-year |
| SUNY College at Cortland | Four-year |
| SUNY College at Geneseo | Four-year |
| SUNY College at Old Westbury | Four-year |
| SUNY College at Oswego | Four-year |
| SUNY College at Plattsburgh | Four-year |
| SUNY College at Potsdam | Four-year |
| SUNY College of Agriculture and Technology at Cobleskill | Four-year, primarily associate's |
| SUNY College of Environmental Science and Forestry | Four-year |
| SUNY College of Optometry | Four-year |
| SUNY College of Technology at Alfred | Four-year, primarily associate's |
| SUNY College of Technology at Canton | Four-year, primarily associate's |
| SUNY College of Technology at Delhi | Four-year, primarily associate's |
| SUNY Downstate Medical Center | Four-year |
| SUNY Empire State College | Four-year |
| SUNY Institute of Technology at Utica-Rome | Four-year |
| SUNY Maritime College | Four-year |
| SUNY Oneonta | Four-year |
| SUNY Westchester Community College | Two-year |
| Tompkins Cortland Community College | Two-year |
| Ulster County Community College | Two-year |
| United States Merchant Marine Academy | Four-year |
| United States Military Academy | Four-year |
| University at Buffalo | Four-year |
| Upstate Medical University | Four-year |
| Source: National Center for Education Statistics, "College Navigator - New York" | |
State agencies
The New York State Higher Education Services Corporation is the state's agency that compiles and provides information to students about higher education. The corporation provides information on financial aid, types of schools available, loan repayment, and information specific to non-traditional or special-case students.[8]
Admissions
Enrollment
- See also: Higher education enrollment statistics
According to the State Higher Education Executive Officers Association, college enrollment typically rises during economic downturns and declines as the economy improves. In 2014, higher education enrollment nationwide was 8.6 percent higher than pre-recession levels in 2008. However, enrollment has been declining since 2012. Full-time enrollment in higher education institutions rose sharply following the recession before peaking in 2011 and then dropping off.[9]
College enrollment in New York followed this trend; between 2012 and 2014, full-time enrollment decreased from about 583,025 to about 565,830. In 2014, full-time college enrollment in New York was 7.5 percent higher than in 2008. Click [show] on the green bar below the bar chart to view full-time public university enrollment in New York as compared to surrounding states.
| Full-time enrollment in public postsecondary institutions, FY 2008 to FY 2014 | ||||||||
|---|---|---|---|---|---|---|---|---|
| State | FY 2008 (pre-recession) | FY 2009 | FY 2012 | FY 2013 | FY 2014 | 1-year change | 5-year change | Change since recession |
| New York | 526,538 | 547,845 | 583,025 | 571,801 | 565,830 | -1.0% | 3.3% | 7.5% |
| Connecticut | 77,088 | 80,433 | 85,683 | 87,810 | 88,681 | 1.0% | 10.3% | 15.0% |
| New Jersey | 238,040 | 246,215 | 278,868 | 276,052 | 274,341 | -0.6% | 11.4% | 15.2% |
| Pennsylvania | 343,043 | 353,494 | 369,046 | 364,468 | 358,820 | -1.5% | 1.5% | 4.6% |
| United States | 10,254,148 | 10,721,466 | 11,563,321 | 11,288,232 | 11,137,541 | -1.3% | 3.9% | 8.6% |
| Note: Full-time enrollment excludes medical students.[9] Source: State Higher Education Executive Officers Association, "State Higher Education Finance: FY 2014" | ||||||||
Demographics
Enrollment by race and ethnicity
In New York, total enrollment—full-time and part-time—in all public and private higher education institutions amounted to 1,304,230 in fall 2013. About 52.1 percent of these students were white. Hispanic students comprised approximately 15.6 percent of the total postsecondary student population in New York. During that time, 56.2 percent of the state's general population was white and 16.8 percent was Hispanic, with other ethnic groups comprising the remainder. The table below lists demographic information for both postsecondary students and the general population in New York and surrounding states.[10]
| Higher education enrollment by race/ethnicity, 2013 | |||||||||
|---|---|---|---|---|---|---|---|---|---|
| State | Population category | White | Black | Hispanic | Asian | Pacific Islander | American Indian/Alaska Native | Two or more races | Non-resident alien |
| New York | Postsecondary students | 52.1% | 13.9% | 15.6% | 8.8% | 0.2% | 0.4% | 1.8% | 7.3% |
| General population | 56.2% | 15.0% | 16.8% | 9.5% | 0.3% | 0.4% | 1.9% | N/A | |
| Connecticut | Postsecondary students | 62.6% | 12.5% | 13.2% | 4.8% | 0.1% | 0.3% | 2.2% | 4.4% |
| General population | 65.5% | 13.1% | 13.8% | 5.0% | 0.1% | 0.3% | 2.3% | N/A | |
| New Jersey | Postsecondary students | 51.3% | 14.9% | 18.9% | 8.5% | 0.3% | 0.3% | 1.8% | 4.0% |
| General population | 53.5% | 15.5% | 19.7% | 8.8% | 0.4% | 0.3% | 1.9% | N/A | |
| Pennsylvania | Postsecondary students | 70.2% | 11.6% | 6.0% | 4.7% | 0.1% | 0.2% | 2.1% | 5.0% |
| General population | 73.9% | 12.2% | 6.3% | 4.9% | 0.1% | 0.2% | 2.2% | N/A | |
| United States | Postsecondary students | 56.9% | 14.1% | 15.2% | 5.9% | 0.3% | 0.8% | 2.7% | 4.1% |
| General population | 59.3% | 14.7% | 15.8% | 6.1% | 0.3% | 0.8% | 2.9% | N/A | |
| Source: National Center for Education Statistics, "Table 306.60. Fall enrollment in degree-granting postsecondary institutions, by race/ethnicity of student and state or jurisdiction: 2013" | |||||||||
Enrollment by sex
In 2013, 56.4 percent of all postsecondary students in New York were female, which was on par with the national rate of 56.5 percent. The table below lists postsecondary student enrollment by sex in New York and surrounding states.[11]
| Higher education enrollment by sex, 2013 | |||||
|---|---|---|---|---|---|
| State | Total students | Male students | Percentage | Female students | Percentage |
| New York | 1,304,230 | 568,124 | 43.6% | 736,106 | 56.4% |
| Connecticut | 200,966 | 85,657 | 42.6% | 115,309 | 57.4% |
| New Jersey | 436,939 | 198,902 | 45.5% | 238,037 | 54.5% |
| Pennsylvania | 765,582 | 338,690 | 44.2% | 426,892 | 55.8% |
| United States | 20,375,789 | 8,860,786 | 43.5% | 11,515,003 | 56.5% |
| Source: National Center for Education Statistics, "Table 304.30. Total fall enrollment in degree-granting postsecondary institutions, by attendance status, sex, and state or jurisdiction: 2012 and 2013" | |||||
Affirmative action
- See also: Affirmative action and Affirmative action in New York
Federal law requires government contractors and other departments and agencies receiving federal funding to develop and implement affirmative action plans for the hiring process. Public colleges and universities are considered federal contractors and must utilize affirmative action in their employment practices. However, many private and public colleges and universities across the country have also implemented similar measures in their admissions processes. These actions are typically voluntary, although a handful of states have adopted rules that require state universities to take affirmative action in admissions.[12][13][14]
Affirmative action admissions programs were undertaken by public and private universities alike, beginning in the late 1960s and 1970s. Some universities initially established quotas in order to achieve a demographically diverse student body; these quotas were outlawed by the United States Supreme Court in Regents of the University of California v. Bakke in 1978.[12][15]
Affirmative action can also take other forms, such as targeted outreach campaigns. Today, a common form of affirmative action in college admissions is that of racial preferences. A preference occurs when a group of applicants is more likely to be admitted than other applicants with similar or better qualifications due to other factors, such as race or ethnicity. Preferences are also sometimes extended towards women, athletes, and children of alumni. The use of racial preferences may be related to college selectivity: scholars such as law professor Richard Sander have found that preferences are strongest at elite institutions.[12][15][16][17]
Eight states have enacted laws banning the consideration of race in university admissions. As of March 2015, New York was not one of these states. Of 35 public four-year universities in New York, 11 reported considering race in admissions, as indicated in the chart below.
| Consideration of race at public four-year universities in New York | |||||
|---|---|---|---|---|---|
| School | Race/ethnicity is... | School selectivity* | |||
| Very important | Important | Considered | Not considered | ||
| CUNY: Baruch College | Very selective | ||||
| CUNY: Brooklyn College | Very selective | ||||
| CUNY: City College | Most selective | ||||
| CUNY: College of Staten Island | Open admission | ||||
| CUNY: Hunter College | Very selective | ||||
| CUNY: John Jay College of Criminal Justice | Somewhat selective | ||||
| CUNY: Lehman College | N/A | ||||
| CUNY: Medgar Evers College | Open admission | ||||
| CUNY: New York City College of Technology | N/A | Open admission | |||
| CUNY: Queens College | Very selective | ||||
| CUNY: York College | Somewhat selective | ||||
| Fashion Institute of Technology | Very selective | ||||
| SUNY College at Brockport | Very selective | ||||
| SUNY College at Buffalo | Somewhat selective | ||||
| SUNY College at Cortland | Very selective | ||||
| SUNY College at Fredonia | Somewhat selective | ||||
| SUNY College at Geneseo | Somewhat selective | ||||
| SUNY College at New Paltz | Very selective | ||||
| SUNY College at Old Westbury | Somewhat selective | ||||
| SUNY College at Oneonta | Very selective | ||||
| SUNY College at Oswego | Very selective | ||||
| SUNY College at Plattsburgh | Very selective | ||||
| SUNY College at Potsdam | Somewhat selective | ||||
| SUNY College at Purchase | Very selective | ||||
| SUNY College of Environmental Science and Forestry | Somewhat selective | ||||
| SUNY Empire State College | Less selective | ||||
| SUNY Farmingdale State College | Very selective | ||||
| SUNY Institute of Technology at Utica-Rome | Somewhat selective | ||||
| SUNY Maritime College† | Somewhat selective | ||||
| SUNY University at Albany | Somewhat selective | ||||
| SUNY University at Binghamton | Very selective | ||||
| SUNY University at Buffalo | Somewhat selective | ||||
| SUNY University at Stony Brook | Very selective | ||||
| United States Merchant Marine Academy | Most selective | ||||
| United States Military Academy | Most selective | ||||
| Sources: The College Board, "Big Future". Reproduced with permission. CollegeData, "College 411" *Note: This scale of college selectivity comes from The College Board and is measured as follows: Most selective, less than 25 percent admitted; Very selective, 25 percent to 50 percent admitted; Somewhat selective, 50 percent to 75 percent admitted; Less selective, more than 75 percent admitted; Open admission, all or most admitted. †Note: Ballotpedia found conflicting reports on the SUNY Maritime College. According to College Board, the SUNY Maritime College does consider race in admissions; however, College Data reported that the university does not consider race in its admissions decisions. | |||||
| Click [show] to learn more about the data | ||||||||||||||||||||||||||||||||||||||||||||||||||||||||||||||||||||||||||||||||||||||||||||||||||||||||||||||||||||||||||||
|---|---|---|---|---|---|---|---|---|---|---|---|---|---|---|---|---|---|---|---|---|---|---|---|---|---|---|---|---|---|---|---|---|---|---|---|---|---|---|---|---|---|---|---|---|---|---|---|---|---|---|---|---|---|---|---|---|---|---|---|---|---|---|---|---|---|---|---|---|---|---|---|---|---|---|---|---|---|---|---|---|---|---|---|---|---|---|---|---|---|---|---|---|---|---|---|---|---|---|---|---|---|---|---|---|---|---|---|---|---|---|---|---|---|---|---|---|---|---|---|---|---|---|---|---|
Information on which colleges consider race in admissions came from individual college profiles provided by two websites that aim to assist students in choosing a college: The College Board and CollegeData. Such information was reported to The College Board by the colleges themselves. Note that schools may have updated their policies since reporting them. To see the data:
| ||||||||||||||||||||||||||||||||||||||||||||||||||||||||||||||||||||||||||||||||||||||||||||||||||||||||||||||||||||||||||||
Student costs
- See also: Higher education tuition statistics
In-state and private tuition
Tuition accounts for just a portion of student costs; in many states, the cost of room and board equals or surpasses the cost of tuition at public universities. However, unlike room and board, tuition has risen much faster than inflation, increasing by 40 percent between the 2005-2006 and the 2015-2016 school years. The consumer price index increased by 21.5 percent over the same time period. Some studies suggest that universities have increased tuition as a response to state budget cuts, while others correlate rising tuition with the availability of financial aid.[18][19][20]
In the 2013-2014 academic year, the national average in-state cost for tuition and required fees at a public four-year school totaled $8,312. For a private four-year school, the average was $25,696. In New York, these figures were lower for public institutions and higher for private institutions: $6,892 and $33,825, respectively. Public university tuition in the state increased 25 percent between 2005-2006 and 2015-2016. The graph below displays average tuition prices in New York as compared to the nationwide average for each year during that time. Hover over the points to view precise figures. The table below the graph compares 2013-2014 average annual tuition costs in New York with those in surrounding states.[19][21]
- Note: Discrepancies in data between the line graph and the table below are due to differing sources of information.
| Higher education tuition and fees at 4-year institutions, 2013-2014 (in current dollars) | |||||||
|---|---|---|---|---|---|---|---|
| State | Public in-state | Private | |||||
| 2012-2013 | 2013-2014 | Percent change | 2012-2013 | 2013-2014 | Percent change | ||
| New York | $6,556 | $6,892 | 5.1% | $32,438 | $33,825 | 4.3% | |
| Connecticut | $9,517 | $10,128 | 6.4% | $35,336 | $35,407 | 0.2% | |
| New Jersey | $11,955 | $12,266 | 2.6% | $31,195 | $32,010 | 2.6% | |
| Pennsylvania | $12,184 | $12,607 | 3.5% | $32,949 | $34,313 | 4.1% | |
| United States | $8,070 | $8,312 | 3.0% | $24,525 | $25,696 | 4.8% | |
| Note: Dollar figures do not account for differences in the cost of living between states. Learn more here. Source: National Center for Education Statistics, "Table 330.20. Average undergraduate tuition and fees and room and board rates charged for full-time students in degree-granting postsecondary institutions, by control and level of institution and state or jurisdiction: 2012-13 and 2013-14" | |||||||
Out-of-state tuition
- See also: Higher education tuition statistics
Public postsecondary schools receive some of their funding from their state's government. This money in turn comes from taxation of the state's residents. Since neither out-of-state students nor their parents paid that state's taxes, the schools charge these students additional tuition to account for the difference. This additional charge is a significant increase over in-state tuition in all 50 states. In the 2013-2014 school year, out-of-state students nationwide paid an average of $22,603 in annual tuition and required fees, 272 percent higher than the in-state average of $8,312.[19]
Students attending public postsecondary institutions in New York from outside of the state were required to pay an average of $17,082, a 248 percent difference over the average in-state tuition of $6,892. The average out-of-state tuition price for New York was lower than the national average by about $5,500. The table below compares in-state and out-of-state tuition figures for New York with those of surrounding states.
| Average annual in-state and out-of-state tuition and required fees, 2013-2014 | |||
|---|---|---|---|
| State | Average in-state tuition | Average out-of-state tuition | Percent difference |
| New York | $6,892 | $17,082 | 248% |
| Connecticut | $10,128 | $28,337 | 280% |
| New Jersey | $12,266 | $25,637 | 209% |
| Pennsylvania | $12,607 | $23,571 | 187% |
| United States | $8,312 | $22,603 | 272% |
| Note: Dollar figures do not account for differences in the cost of living between states. Learn more here. Source: National Center for Education Statistics, "Table 330.20. Average undergraduate tuition and fees and room and board rates charged for full-time students in degree-granting postsecondary institutions, by control and level of institution and state or jurisdiction: 2012-13 and 2013-14" | |||
August 14, 2017: Mary Clare Amselem, an education policy analyst at the Heritage Foundation, claimed that "Economists have found that virtually unrestricted access to federal student aid encourages colleges and universities to raise their tuition prices."
Is Amselem correct that research shows federal student aid increases tuition?
Read Ballotpedia's fact check »
Financial aid
The federal government provides financial aid to undergraduate students in the form of grants and loans. Notable grants administered by the United States government include Pell Grants and Federal Supplemental Educational Opportunity Grants (FSEOG). Loan programs administered by the federal government include the William D. Ford Federal Direct Loan (Direct Loan) Program and Federal Perkins Loan Program. Perkins Loans have an interest rate of 5 percent, while Direct Loans have interest rates that vary based on the date of disbursement and the loan type: loans disbursed between July 1, 2014, and July 1, 2017, have interest rates ranging from 3.76 percent to 7.21 percent. According to the U.S. Department of Education, the average default rate on Perkins Loans was 11.8 percent for borrowers who entered into repayment in 2012; the rate reflects borrowers who defaulted prior to September 30, 2014. This is compared to average default rates of 7.2 percent on home loans and 2.23 percent on credit card loans in 2014.[22][23][24][25][26][27]
In addition, colleges and universities often offer institution-specific financial aid to their students, and individual states may also administer student financial aid programs. According to the National Association of State Student Grant and Aid Programs, the states disbursed approximately $11.7 billion in state-based financial aid to postsecondary students in the 2013-2014 academic year. This represented about 5 percent of all financial aid provided to undergraduate students, according to The College Board. New York awarded $1.06 billion in state-based financial aid during that time. The table below provides state-based aid figures for New York and surrounding states in 2013-2014.[28][29]
| Total state-based financial aid, 2013-2014 (in millions) | ||||
|---|---|---|---|---|
| State | Need-based grant aid | Non-need-based grant aid | Non-grant aid | Total |
| New York | $947.61 | $30.44 | $79.85 | $1,057.9 |
| Connecticut | $39.81 | $0.27 | $106.9 | $146.98 |
| New Jersey | $385.29 | $7.76 | $193.02 | $586.07 |
| Pennsylvania | $457.45 | $1.82 | $23.3 | $482.56 |
| United States | $7,491.27 | $2,446.92 | $1,756.51 | $11,694.70 |
| Note: Dollar figures do not account for differences in the cost of living between states. Learn more here. Source: National Association of State Student Grant and Aid Programs, "45th Annual Survey Report on State-Sponsored Student Financial Aid" | ||||
Student debt
Student debt is a major concern for both parents and students. According to the Institute for College Access and Success, in school year 2013-2014, an average of 62 percent of all students nationwide graduated with debt at an average of about $27,779 per borrower. The state with the lowest average debt held by students was Utah, where average student debt was about $18,921. Conversely, students who graduated from colleges and universities in Delaware held an average of about $33,808 in debt, the highest in the country.[30][31]
During the 2013-2014 school year, about 61 percent of postsecondary students at both public and private schools in New York graduated with debt. Average debt held amounted to about $27,822, ranking 19th highest in the country. The table below compares the average student debt, percentage of graduates with debt, and national rankings of New York and surrounding states.
| Average student debt and percentage of graduates with debt, 2013-2014 | ||||
|---|---|---|---|---|
| State | Average debt | National rank | Percentage with debt | National rank |
| New York | $27,822 | 19 | 61% | 26 |
| Connecticut | $29,750 | 7 | 62% | 21 |
| New Jersey | $28,318 | 18 | 68% | 10 |
| Pennsylvania | $33,264 | 3 | 70% | 3 |
| United States | $27,779 | -- | 62% | -- |
| Source: CollegeInSight, "Explore All Data" | ||||
While tuition for private schools is typically higher than that of public schools, debt does not always follow this same pattern. The Institute for College Access and Success analyzed data on student debt held by graduates of public and private schools. They found that in the 2013-2014 school year, about 60 percent of students nationwide who graduated from a public institution had debt, which averaged about $25,665 per borrower. For private schools, they found that approximately 65 percent of students graduated with an average of $28,498 in debt. However, in some states, such as New Hampshire, students on average graduated from private schools with less debt than those who graduated from public schools.[30][31]
During the 2013-2014 school year, about 54 percent of graduates from New York's public schools graduated with an average of $23,774 in debt. About 67 percent of private school students graduated with an average of $30,268 in debt. As this data shows, students who graduated from public schools during this year had less debt on average than those who graduated from private schools. The table below compares these statistics for New York with those of its surrounding states.
| Average student debt from public and private colleges, 2013-2014 | ||||
|---|---|---|---|---|
| State | Public in-state institution | Private institution | ||
| Average debt | Percent of graduates with debt | Average debt | Percent of graduates with debt | |
| New York | $23,774 | 54% | $30,268 | 67% |
| Connecticut | $24,831 | 65% | $36,242 | 59% |
| New Jersey | $28,345 | 69% | $28,153 | 62% |
| Pennsylvania | $33,547 | 72% | $32,833 | 67% |
| United States | $25,902 | 60% | $29,657 | 64% |
| Source: CollegeInSight, "Explore All Data" | ||||
Outcomes
Retention rates
- See also: Higher education retention rates
Retention rates indicate the percentage of freshmen postsecondary students who enroll the following academic year as sophomores. According to the NCHEMS Information Center for Higher Education Policymaking and Analysis:[32]
| “ | Students are more likely to drop out of postsecondary education during the first year than any other time. If a state can implement policies that help to increase retention rates either within institutions or through transfer, the likelihood of students persisting to graduation is far greater.[32][33] | ” |
| —NCHEMS Information Center for Higher Education Policymaking and Analysis | ||
Compared to neighboring states, New York tied with Pennsylvania for the highest total retention rate in the 2013-2014 school year at 75 percent. The table below compares retention rates in New York and surrounding states.[34]
| Higher education retention rates, 2013-2014 | ||||||||||
|---|---|---|---|---|---|---|---|---|---|---|
| State | Total | Public | Private nonprofit | Private for-profit | ||||||
| 2-year | 4-year | 2-year | 4-year | 2-year | 4-year | |||||
| New York | 75% | 62% | 83% | 52% | 84% | 53% | 67% | |||
| Connecticut | 74% | 61% | 84% | N/A | 83% | 79% | 39% | |||
| New Jersey | 73% | 63% | 85% | 47% | 81% | 74% | 61% | |||
| Pennsylvania | 75% | 59% | 81% | 60% | 84% | 69% | 47% | |||
| United States | 71% | 60% | 79% | 62% | 80% | 68% | 54% | |||
| Source: CollegeInSight, "Explore All Data" | ||||||||||
Graduation rates
- See also: Higher education graduation rates
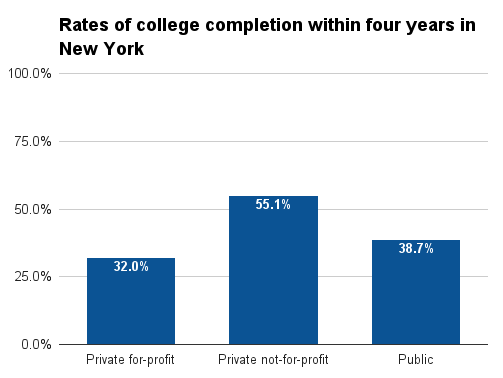
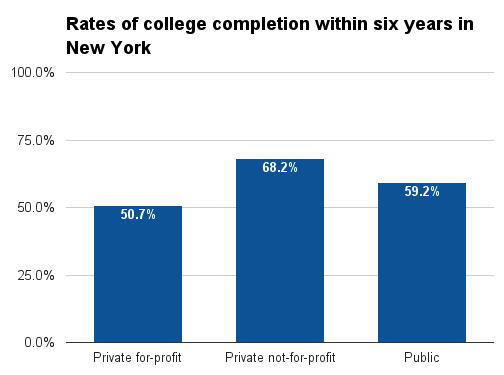
The table below, built from data compiled by The Chronicle of Higher Education, details graduation rates for New York and surrounding states. Although postsecondary schools are classified as four-year and two-year institutions, relatively few students actually complete degrees within these time frames. At four-year schools, students commonly take between four and six years to complete their degrees. Likewise, students at two-year institutions commonly take three years to complete their degrees. To illustrate this point, both four-year and six-year graduation rates are provided in the table below (only three-year rates are provided for two-year institutions, owing to a lack of information regarding two-year completion rates).[35]
At public four-year colleges in New York, 38.7 percent graduated within four years, while 59.2 percent graduated within six years. These figures were lower than in neighboring states. About 20.6 percent of New York students at public two-year colleges graduated within three years; this figure was higher than in neighboring states.[36]
| Graduation rates by state, 2013 | ||||||||
|---|---|---|---|---|---|---|---|---|
| State | Four-year institutions | Two-year institutions | ||||||
| Completion within four years | Completion within six years | Completion within three years | ||||||
| Public | Private nonprofit | Private for-profit | Public | Private nonprofit | Private for-profit | Public | Private for-profit | |
| New York | 38.7% | 55.1% | 32.0% | 59.2% | 68.2% | 50.7% | 20.6% | 36.7% |
| Connecticut | 40.8% | 66.9% | 27.7% | 63.4% | 74.1% | 36.8% | 12.1% | N/A |
| New Jersey | 42.2% | 49.6% | 20.2% | 67.2% | 64.8% | 26.5% | 16.3% | 67.5% |
| Pennsylvania | 41.6% | 60.8% | 21.7% | 62.9% | 71.4% | 29.5% | 14.3% | 62.3% |
| United States | 33.3% | 52.8% | 23.3% | 57.6% | 65.4% | 33.2% | 19.4% | 63.1% |
| Source: The Chronicle of Higher Education, "Graduation rates by state" | ||||||||
Study on college affordability and outcomes
College affordability and student debt have become major issues in higher education policy, particularly since the 2008 recession. The College Affordability Guide is an organization that evaluates colleges for their value, which is defined as providing a high-quality education that is affordable "not only for the average student, but for lower-income students as well." According to the College Affordability Guide, there are 47 colleges in New York that provide high-quality education at an affordable price. The College Affordability Guide's rankings consider a number of factors and are based on the idea that income-appropriate tuition, completing one's studies, and being able to pay back one's loans are the key elements of a worthwhile college experience. Colleges considered the best value by the guide meet the following criteria:[37]
- Tuition at an average net price of $15,000 per year or less after financial aid for families making $48,000 per year or less
- At least 50 percent of students graduate or transfer
- At least 50 percent of students are actively paying down student loan debt three years after graduation
Additionally, all colleges considered are not-for-profit, offer associate or higher degrees, and have at least one non-standard way for students to earn college credits, such as AP or CLEP credit. The table below lists the colleges in New York that the College Affordability Guide considers to be the best value. The colleges are in no particular order. Full rankings and descriptions of the colleges can be found here.
| Most affordable colleges in New York, 2016 | |||
|---|---|---|---|
| College | Average net price | Percent of students graduating or transferring | Percent of students repaying loans |
| Alfred University | $13,000 | 91.0% | 87.3% |
| Barnard College | $9,000 | 96.0% | 97.5% |
| Canisius College | $13,000 | 68.0% | 87.0% |
| Cazenovia College | $11,000 | 55.0% | 85.8% |
| CUNY Bernard M Baruch College | $6,000 | 84.0% | 86.5% |
| CUNY Brooklyn College | $6,000 | 76.0% | 78.4% |
| CUNY College of Staten Island | $8,000 | 59.0% | 70.1% |
| CUNY City College | $5,000 | 76.0% | 74.5% |
| CUNY Hunter College | $6,000 | 79.0% | 82.1% |
| CUNY John Jay College of Criminal Justice | $4,000 | 72.0% | 71.8% |
| CUNY Lehman College | $2,000 | 64.0% | 73.4% |
| CUNY New York City College of Technology | $6,000 | 56.0% | 64.1% |
| CUNY Queens College | $5,000 | 77.0% | 82.2% |
| CUNY York College | $5,000 | 68.0% | 66.9% |
| Fashion Institute of Technology | $8,000 | 87.0% | 89.1% |
| Herkimer County Community College | $6,000 | 51.0% | 57.5% |
| Hilbert College | $12,000 | 86.0% | 73.1% |
| Niagara University | $14,000 | 93.0% | 87.0% |
| The Sage Colleges | $12,000 | 59.0% | 84.6% |
| St. Francis College | $12,000 | 55.0% | 73.4% |
| Saint Joseph's College-New York | $11,000 | 91.0% | 85.1% |
| SUNY College of Technology at Alfred | $11,000 | 70.0% | 80.8% |
| SUNY College of Technology at Canton | $9,000 | 61.0% | 67.8% |
| SUNY College of Technology at Delhi | $10,000 | 69.0% | 76.6% |
| SUNY College of Agriculture and Technology at Cobleskill | $12,000 | 66.0% | 76.6% |
| Farmingdale State College | $4,000 | 79.0% | 85.7% |
| Morrisville State College | $13,000 | 58.0% | 67.4% |
| SUNY at Albany | $11,000 | 83.0% | 87.4% |
| SUNY at Binghamton | $12,000 | 90.0% | 92.2% |
| University at Buffalo | $11,000 | 88.0% | 88.1% |
| Stony Brook University | $9,000 | 90.0% | 88.3% |
| SUNY College of Environmental Science and Forestry | $12,000 | 88.0% | 93.2% |
| SUNY Polytechnic Institute | $10,000 | 74.0% | 86.2% |
| SUNY College at Brockport | $10,000 | 87.0% | 86.2% |
| Buffalo State SUNY | $8,000 | 74.0% | 78.8% |
| SUNY College at Cortland | $11,000 | 92.0% | 90.9% |
| SUNY at Fredonia | $11,000 | 89.0% | 88.3% |
| State University of New York at New Paltz | $10,000 | 87.0% | 88.4% |
| SUNY College at Oneonta | $10,000 | 89.0% | 90.1% |
| SUNY College at Oswego | $11,000 | 88.0% | 87.0% |
| SUNY College at Potsdam | $10,000 | 81.0% | 82.2% |
| SUNY at Purchase College | $14,000 | 81.0% | 87.6% |
| SUNY College at Old Westbury | $4,000 | 66.0% | 68.7% |
| SUNY College at Plattsburgh | $10,000 | 84.0% | 86.4% |
| SUNY Maritime College | $11,000 | 69.0% | 86.3% |
| Tompkins Cortland Community College | $8,000 | 53.0% | 59.6% |
| Trocaire College | $11,000 | 68.0% | 65.5% |
| Source: College Affordability Guide, "2016 Most Affordable Colleges in New York" | |||
Funding
Total state funding
- See also: Higher education funding and New York state budget and finances
Higher education funding mechanisms differ depending on the type of institution. Public colleges receive the lion's share of their funding from state and local governments. According to the Center on Budget and Policy Priorities, state and local appropriations accounted for 53 percent of higher education revenues nationwide in 2013. By contrast, private institutions do not receive direct government funding. Instead, these institutions rely primarily on tuition, gifts, and endowments.[38][39]
The 2008 recession led to decreased public higher education funding as college enrollment increased:
| “ | By 2012, the tuition revenues collected by public universities in 20 states covered more educational costs than did state-provided dollars.[33] | ” |
| —Texas Coalition for Excellence in Higher Education[40] | ||
While there have been moderate increases in state allocations between 2012 and 2015, the average amount of spending "is still 15 percent less, per student, than before the economic downturn," according to a study by the State Higher Education Executive Offices (SHEEO).[41]
According to Grapevine, which is published by Illinois State University's Center for the Study of Education Policy and SHEEO, financial support for public higher education in New York totaled $5.5 billion in fiscal year 2015, a 6.9 percent increase over fiscal year 2013. The table below lists higher education fiscal support figures for New York and surrounding states.[42]
| State funding for higher education | ||||
|---|---|---|---|---|
| State | Fiscal year 2013 | Fiscal year 2014 | Fiscal year 2015 | Percent change |
| New York | $5,113,034,854 | $5,283,125,597 | $5,466,691,712 | 6.9% |
| Connecticut | $887,708,438 | $1,018,691,658 | $1,117,135,194 | 25.8% |
| New Jersey | $1,888,439,000 | $1,990,469,000 | $2,070,674,000 | 9.7% |
| Pennsylvania | $1,632,655,000 | $1,644,692,000 | $1,658,992,000 | 1.6% |
| United States | $72,493,483,464 | $76,950,508,609 | $80,973,621,292 | 11.7% |
| Note: Dollar figures do not account for differences in the cost of living between states. Learn more here. Source: Grapevine, "Table 1: State Fiscal Support for Higher Education, by State, Fiscal Years 2009-10, 2012-13, 2013-14, and 2014-15" | ||||
Funding per student
According to the State Higher Education Executive Officers Association, average adjusted public postsecondary appropriations per full-time student declined 13.3 percent from fiscal year 2009 to 2013 on average in the United States. In New York, appropriations per full-time student declined 2.4 percent during that same period. The table below lists adjusted public higher education appropriations per full-time student for New York and surrounding states in fiscal years 2009, 2013, and 2014.[9]
| Public higher education appropriations per full-time student (in constant 2014 dollars) | ||||||
|---|---|---|---|---|---|---|
| State | Fiscal year 2009 | Fiscal year 2013 | Fiscal year 2014 | 1 year change | 5 year change | Change since recession |
| New York | $8,659 | $8,129 | $8,454 | 4.0% | -2.4% | -4.7% |
| Connecticut | $9,192 | $6,509 | $7,192 | 10.5% | -21.8% | -26.3% |
| New Jersey | $7,206 | $5,658 | $5,520 | -2.4% | -23.4% | -28.3% |
| Pennsylvania | $5,645 | $3,633 | $3,654 | 0.6% | -35.3% | -37.4% |
| United States | $7,553 | $6,215 | $6,552 | 5.4% | -13.3% | -18.9% |
| Notes: "Educational appropriations are a measure of state and local support available for public higher education operating expenses including ARRA funds, and exclude appropriations for independent institutions, financial aid for students attending independent institutions, research, hospitals, and medical education." "Adjustment factors, to arrive at constant dollar figures, include Cost of Living Adjustment (COLA), Enrollment Mix Index (EMI), and Higher Education Cost Adjustment (HECA). The Cost of Living Adjustment (COLA) is not a measure of inflation over time." Source: State Higher Education Executive Officers Association, "State Higher Education Finance: FY 2014" | ||||||
Faculty
Faculty
- See also: Higher education faculty statistics
Across the country, as student enrollment at postsecondary institutions has changed, so has the faculty. To meet rising demand, the number of faculty increased nationwide by just over 55 percent, from 515,684 to 800,611, between the 1993-1994 and 2013-2014 school years. In New York, the total number of faculty rose from 26,424 to 35,527. According to the Bureau of Labor Statistics, the college faculty profession has one of the fastest growth rates in the nation and will see a 19 percent increase in jobs between 2012 and 2022.[43][44][45]
Employment status
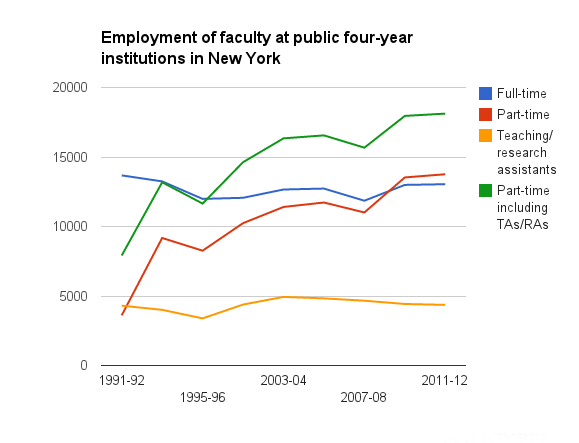
While the total number of faculty at public colleges and universities continued to rise over the previous two decades, the portion of faculty who work part time rose more quickly. By the mid-1990s, part-time faculty comprised over half of total instructional faculty, a figure which continued to increase before leveling off in 2013. In the 2013-2014 school year, just over 55 percent of instructional faculty nationwide worked part time. The number of part-time faculty, including teaching and research assistants, outnumbered full-time faculty in all but 11 states. The number of teaching and research assistants alone outnumbered full-time faculty in five states. New York was not one of these states. According to the Southern Regional Education Board,[43][44]
| “ | The fact that part-time faculty and teaching/research assistants are a majority of the instructional staff does not mean they do a majority of the instruction, because part-time faculty members and teaching/research assistants typically do not teach as many classes as full-time faculty members. Part-time faculty members generally do not have campus committee assignments or participate in student activities.[33] | ” |
| —Southern Regional Education Board[43] | ||
In New York, the percentage of all part-time faculty, including graduate assistants, increased from 49.9 percent to 59.6 percent between the 1993-1994 and 2013-2014 school years. Below is a table that provides figures on full-time and part-time faculty employment in New York as compared to surrounding states.[44]
| Employment status of instructional faculty at public four-year institutions | ||||||||||
|---|---|---|---|---|---|---|---|---|---|---|
| State | 1993-1994 | 2013-2014 | ||||||||
| Full time faculty | Part time faculty | Graduate assistants | Part-time total as a percent of all faculty* | Full time faculty | Part time faculty | Graduate assistants | Part-time total as a percent of all faculty* | |||
| New York | 13,245 | 9,174 | 4,005 | 49.9% | 14,348 | 15,116 | 6,063 | 59.6% | ||
| Connecticut | 2,180 | 1,421 | 2,054 | 61.5% | 3,574 | 2,017 | 2,583 | 56.3% | ||
| New Jersey | 4,952 | 1,373 | 2,199 | 41.9% | 8,138 | 8,759 | 3,013 | 59.1% | ||
| Pennsylvania | 13,461 | 3,854 | 6,712 | 44.0% | 16,623 | 6,158 | 8,725 | 47.2% | ||
| United States | 265,469 | 83,579 | 166,636 | 48.5% | 359,586 | 163,962 | 277,063 | 55.1% | ||
| *"Part-time total" includes teaching and research assistants, who also work part time. Source: Southern Regional Education Board, "Fact Book Tables" | ||||||||||
Salaries
According to the Southern Regional Education Board, although the salaries of full-time faculty at public four-year institutions are higher than the those of the average American worker, their growth has not kept pace with the average rate of salary increases across all professions. However, salary growth at private institutions has outpaced the national average rate. From the 2008-2009 to the 2013-2014 school years, the average salary for full-time instructional faculty at public four-year institutions nationwide rose from $76,009 to $79,293. In New York, the average salary decreased from $80,190 to $72,107. The table below provides faculty salary information for the school years 2008-2009 and 2013-2014 for New York and surrounding states. Dollar figures have not been adjusted for inflation.[44]
| Average salaries of full-time instructional faculty at public four-year institutions, 2013-2014 | ||||
|---|---|---|---|---|
| State | Average salary 2008-2009 | Average salary 2013-2014 | Percent change | Inflation-adjusted percent change |
| New York | $80,190 | $72,107 | -10.1% | 1.6% |
| Connecticut | $88,158 | $90,638 | 2.8% | -2.4% |
| New Jersey | $95,012 | $94,076 | -1.0% | 0.1% |
| Pennsylvania | $77,307 | $83,268 | 7.7% | -0.3% |
| United States | $76,009 | $79,293 | 4.3% | -1.5% |
| Note: Dollar figures do not account for differences in the cost of living between states. Learn more here. Source: Southern Regional Education Board, "Fact Book Tables" | ||||
Demographics
Over the previous two decades, the proportions of female, black, and Hispanic faculty members at public colleges and universities nationwide increased to reach their highest levels ever in the 2013-2014 school year. In New York, 43.9 percent of full-time college faculty were female, 6.6 percent were black, and 4.9 percent were Hispanic. Female, black, and Hispanic representation in college faculty at that time was higher than in the 1993-1994 school year. However, it still fell below the proportions of both the general and college student populations who were female, black, and Hispanic. Click [show] on the green bar below the pie charts to view demographic information for full-time faculty at public four-year colleges and universities in New York from the 1993-1994 to the 2013-2014 school years. For this reason, the pie chart displays a different figure for 'Other' than the table.
| Demographics of full-time faculty at public four-year colleges and universities | ||||||||
|---|---|---|---|---|---|---|---|---|
| State | Year | Total full-time faculty | Percent men | Percent women | Percent white | Percent black | Percent Hispanic | Percent other* |
| New York | 1993-1994 | 13,460 | 69.1% | 30.9% | 85.2% | 5.9% | 3.2% | 5.7% |
| 2013-2014 | 14,348 | 56.1% | 43.9% | 77.1% | 6.6% | 4.9% | 11.2% | |
| Connecticut | 1993-1994 | 2,180 | 70.0% | 30.0% | 88.1% | 3.8% | 2.6% | 5.6% |
| 2013-2014 | 3,574 | 57.7% | 42.3% | 78.6% | 4.2% | 4.2% | 12.2% | |
| New Jersey | 1993-1994 | 4,952 | 67.5% | 32.5% | 84.5% | 6.4% | 2.8% | 6.3% |
| 2013-2014 | 8,138 | 56.2% | 43.8% | 72.9% | 6.3% | 4.4% | 15.7% | |
| Pennsylvania | 1993-1994 | 13,461 | 70.0% | 30.0% | 88.6% | 4.4% | 1.4% | 5.7% |
| 2013-2014 | 16,623 | 58.3% | 41.7% | 81.1% | 4.0% | 3.0% | 11.5% | |
| United States | 1993-94 | 265,685 | 70.2% | 29.8% | 87.1% | 4.8% | 2.2% | 6.0% |
| 2013-2014 | 359,586 | 57.7% | 42.3% | 77.9% | 5.4% | 4.3% | 11.8% | |
| *Represents Asian/Pacific Islanders and American Indian/Alaskan Native Source: Southern Regional Education Board, "Fact Book Tables" | ||||||||
Recent news
The link below is to the most recent stories in a Google news search for the terms New York higher education. These results are automatically generated from Google. Ballotpedia does not curate or endorse these articles.
See also
- Public education in New York
- New York state budget and finances
- Historical higher education information in New York
Higher education in the 50 states
Click on a state below to read more about higher education in that state.
Footnotes
- ↑ 1.0 1.1 National Center for Education Statistics, "College Navigator - New York," accessed July 12, 2016
- ↑ Note: This indicates the retention rate for all postsecondary students, both full-time and part-time.
- ↑ Note: This indicates the percentage of students who graduated from a public four-year institution within six years.
- ↑ American Association of State Colleges and Universities, "Top 10 Higher Education State Policy Issues for 2013," January 2013
- ↑ 5.0 5.1 5.2 5.3 5.4 American Council on Education, "An Overview of Higher Education in the United States: Diversity, Access, and the Role of the Marketplace," accessed December 16, 2014
- ↑ 6.0 6.1 6.2 6.3 6.4 U.S. News and World Report, "U.S. Higher Education Glossary," August 15, 2011 Cite error: Invalid
<ref>tag; name "USnews" defined multiple times with different content Cite error: Invalid<ref>tag; name "USnews" defined multiple times with different content Cite error: Invalid<ref>tag; name "USnews" defined multiple times with different content Cite error: Invalid<ref>tag; name "USnews" defined multiple times with different content - ↑ U.S. News & World Report, "Best colleges - Columbia University," accessed January 6, 2015
- ↑ New York State Higher Education Services Corporation, "Homepage," accessed January 6, 2015
- ↑ 9.0 9.1 9.2 State Higher Education Executive Officers Association, "State Higher Education Finance: FY 2014," accessed July 11, 2016
- ↑ National Center for Education Statistics, "Table 306.60. Fall enrollment in degree-granting postsecondary institutions, by race/ethnicity of student and state or jurisdiction: 2013," accessed July 11, 2016
- ↑ National Center for Education Statistics, "Table 304.30. Total fall enrollment in degree-granting postsecondary institutions, by attendance status, sex, and state or jurisdiction: 2012 and 2013," accessed July 11, 2016
- ↑ 12.0 12.1 12.2 Miller Center of Public Affairs, "Affirmative Action: Race or Class?" accessed February 10, 2015
- ↑ National Conference of State Legislatures, "Affirmative Action | Overview," February 7, 2015
- ↑ Higher Ed Jobs, "Facts and Myths of Affirmative Action," accessed March 25, 2015
- ↑ 15.0 15.1 PBS, "Challenging Race Sensitive Admissions Policies," May 19, 2015
- ↑ Stanford Encyclopedia of Philosophy, "Affirmative Action," September 17, 2013
- ↑ Sander, R. & Taylor S. (2012). Mismatch: How Affirmative Action Hurts Students It's Intended to Help, and Why Universities Won't Admit It. Basic Books.
- ↑ The Huffington Post, "Obama Wants To Permanently Link Pell Grants To Inflation," February 11, 2016
- ↑ 19.0 19.1 19.2 National Center for Education Statistics, "Table 330.20. Average undergraduate tuition and fees and room and board rates charged for full-time students in degree-granting postsecondary institutions, by control and level of institution and state or jurisdiction: 2012-13 and 2013-14," accessed July 12, 2016
- ↑ The College Board, "Tuition and Fees and Room and Board over Time, 2005-06 to 2015-16," accessed July 12, 2016
- ↑ The College Board, "Tuition and Fees by Sector and State over Time," accessed July 12, 2016
- ↑ National Center for Education Statistics, "Fast Facts - Financial aid," accessed December 18, 2014
- ↑ Federal Student Aid: An Office of the U.S. Department of Education, "Grants and Scholarships," accessed December 18, 2014
- ↑ Federal Student Aid: An Office of the U.S. Department of Education, "Loans," accessed December 18, 2014
- ↑ Credible, "What are average student loan interest rates?" June 29, 2016
- ↑ Board of Governors of the Federal Reserve System, "Charge-Off and Delinquency Rates on Loans and Leases at Commercial Banks," May 18, 2016
- ↑ Federal Student Aid, "Three-year Official Cohort Default Rates for Schools," September 30, 2015
- ↑ National Association of State Student Grant and Aid Programs, "45th Annual Survey Report on State-Sponsored Student Financial Aid," accessed July 12, 2016 (Click on "45th Annual Survey" and "NASSGAP Survey Report 13-14" to access this report.)
- ↑ The College Board, "Trends in Student Aid," accessed June 30, 2016 (Click on the dropdown menu under "Trends in Student Aid Report Archive" and select 2014 to access this report)
- ↑ 30.0 30.1 CollegeInSight, "Explore All Data," accessed July 12, 2016
- ↑ 31.0 31.1 CollegeInSight, "Student Debt of Graduating Seniors," accessed July 12, 2016
- ↑ 32.0 32.1 NCHEMS Information Center for Higher Education Policymaking and Analysis, "Retention Rates - First-Time College Freshmen Returning Their Second Year," accessed December 15, 2014
- ↑ 33.0 33.1 33.2 Note: This text is quoted verbatim from the original source. Any inconsistencies are attributable to the original source.
- ↑ CollegeInSight, "Explore All Data," accessed July 12, 2016
- ↑ The Chronicle of Higher Education, "College Completion: Who graduates from college, who doesn't, and why it matters," accessed December 15, 2014
- ↑ The Chronicle of Higher Education, "Graduation rates by state," accessed July 12, 2016
- ↑ College Affordability Guide, "2016 Most Affordable Colleges in New York," accessed August 17, 2016
- ↑ Center on Budget and Policy Priorities, "States Are Still Funding Higher Education Below Pre-Recession Levels," May 1, 2014
- ↑ Business Insider, "Public Vs. Private College: Which Is Better For Your Wallet?" May 22, 2013
- ↑ Texas Coalition for Excellence in Higher Education, "Top 10 Higher Education State Policy Issues for 2013," January 9, 2013
- ↑ The Chronicle of Higher Education, "State Higher-Education Spending Is Up, but Not Above Pre-Recession Level," April 27, 2016
- ↑ Grapevine, "Table 1: State Fiscal Support for Higher Education, by State, Fiscal Years 2009-10, 2012-13, 2013-14, and 2014-15," accessed July 12, 2016
- ↑ 43.0 43.1 43.2 Southern Regional Education Board, "Fact Book on Higher Education, 2013," accessed January 14, 2015
- ↑ 44.0 44.1 44.2 44.3 Southern Regional Education Board, "Fact Book Tables," accessed July 12, 2016
- ↑ Bureau of Labor Statistics, U.S. Department of Labor, "Occupational Outlook Handbook, Postsecondary Teachers," accessed January 15, 2015