Tennessee's 1st Congressional District elections, 2012
2014 →
|
 |
November 6, 2012 |
August 2, 2012 |
Phil Roe |
Phil Roe |
 |
 |
The 1st Congressional District of Tennessee held an election for the U.S. House of Representatives on November 6, 2012. Phil Roe was re-elected on November 6, 2012.[1]
| Candidate Filing Deadline | Primary Election | General Election |
|---|---|---|
Primary: Tennessee has an open primary system, in which any registered voter can choose which party's primary to vote in, without having to be a member of that party.
Voter registration: Voters had to register to vote in the primary by July 3, 2012. For the general election, the voter registration deadline was October 8, 2012.[2]
- See also: Tennessee elections, 2012
Incumbent: Heading into the election the incumbent was Rep. Phil Roe (R), who assumed office in 2009.
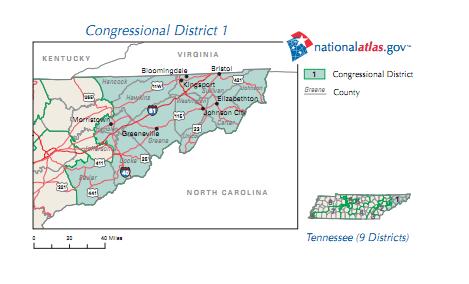
This was the first election which used new district maps based on 2010 Census data. Tennessee's 1st Congressional District is located in the northeastern portion of the state and includes Johnson, Carter, Sullivan, Washington, Unicoi, Greene, Hamblen, Hawkins, Hancock, Cocke, and Sevier counties.[3]
Candidates
Note: Election results were added on election night as races were called. Vote totals were added after official election results had been certified. Click here for more information about Ballotpedia's election coverage plan. Please contact us about errors in this list.
General election candidates
August 2, 2012, primary results
|
|
|
|
Election results
General Election
| Party | Candidate | Vote % | Votes | |
|---|---|---|---|---|
| Democratic | Alan Woodruff | 19.9% | 47,663 | |
| Republican | 76% | 182,252 | ||
| Green | Robert N Smith | 1.2% | 2,872 | |
| Independent | Karen Brackett | 2% | 4,837 | |
| Independent | Michael Salyer | 0.9% | 2,048 | |
| Total Votes | 239,672 | |||
| Source: Tennessee Secretary of State "Official Election Results, 2012 General Election" | ||||
Impact of Redistricting
- See also Redistricting in Tennessee
District partisanship
FairVote's Monopoly Politics 2012 study
- See also: FairVote's Monopoly Politics 2012
In 2012, FairVote did a study on partisanship in the congressional districts, giving each a percentage ranking (D/R) based on the new 2012 maps and comparing that to the old 2010 maps. Tennessee's 1st District became more Republican because of redistricting.[6]
- 2012: 25D / 75R
- 2010: 26D / 74R
Cook Political Report's PVI
In 2012, Cook Political Report released its updated figures on the Partisan Voter Index, which measured each congressional district's partisanship relative to the rest of the country. Tennessee's 1st Congressional District had a PVI of R+21, which was the 16th most Republican district in the country. In 2008, this district was won by John McCain (R), 71-29 percent over Barack Obama (D). In 2004, George W. Bush (R) won the district 69-31 percent over John Kerry (D).[7]
Campaign contributions
Candidates for Congress were required to file up to seven main reports with the Federal Election Commission during the 2012 elections season. Below are candidate reports.
Phil Roe
| Phil Roe (2012) Campaign Finance Reports | |||||||||
|---|---|---|---|---|---|---|---|---|---|
| Report | Date Filed | Beginning Balance | Total Contributions for Reporting Period | Expenditures | Cash on Hand | ||||
| April Quarterly[8] | April 15, 2012 | $446,548.26 | $59,597 | $(51,342.03) | $454,803.23 | ||||
| July Quarterly[9] | July 15, 2012 | $454,803.23 | $101,304.42 | $(82,006.75) | $474,100.9 | ||||
| Running totals | |||||||||
| $160,901.42 | $(133,348.78) | ||||||||
Alan Woodruff
| Alan Woodruff (2012) Campaign Finance Reports | |||||||||
|---|---|---|---|---|---|---|---|---|---|
| Report | Date Filed | Beginning Balance | Total Contributions for Reporting Period | Expenditures | Cash on Hand | ||||
| April Quarterly[10] | April 15, 2012 | $223.46 | $5,100.00 | $(4,044.70) | $1,278.76 | ||||
| July Quarterly[11] | July 15, 2012 | $1,278.76 | $10,861.00 | $(6,770.80) | $5,368.96 | ||||
| Running totals | |||||||||
| $15,961 | $(10,815.5) | ||||||||
District history
2010
On November 2, 2010, Roe won re-election to the United States House of Representatives. He defeated Michael Edward Clark and Kermit E. Steck in the general election.[12]
| U.S. House of Representatives, Tennessee Congressional District 1 Election, 2010 | ||||
|---|---|---|---|---|
| Party | Candidate | Vote % | Votes | |
| Republican | 80.8% | 123,006 | ||
| Democratic | David Edward Clark | 17.1% | 26,045 | |
| Independent | Kermit E. Steck | 2% | 3,110 | |
| Total Votes | 152,161 | |||
See also
- United States House of Representatives elections in Tennessee, 2012
- United States House of Representatives elections, 2012
- United States Senate elections in Tennessee, 2012
Footnotes
- ↑ ABC News, "2012 General Election Results," accessed November 6, 2012
- ↑ Tennessee Secretary of State, "Elections Calendar," accessed July 27, 2012
- ↑ Tennessee Redistricting Map, "Map" accessed July 30, 2012
- ↑ tndp.org "Woodruff Announces Bid for Congress in Upper East Tennessee" accessed January 22, 2012
- ↑ 5.0 5.1 TN.gov "Unofficial U.S. Filings," April 5, 2012
- ↑ "2011 Redistricting and 2012 Elections in Tennessee," September 2012
- ↑ Cook Political Report, "Partisan Voting Index Districts of the 113th Congress: 2004 & 2008" accessed October 2012
- ↑ Federal Election Commission, "Phil Roe July Quarterly," accessed August 8, 2012
- ↑ Federal Election Commission, "Phil Roe Quarterly," accessed August 8, 2012
- ↑ Federal Election Commission, "Alan Woodruff's April Quarterly," accessed August 8, 2012
- ↑ Federal Election Commission, "Alan Woodruff's July Quarterly," accessed August 8, 2012
- ↑ U.S. Congress House Clerk, "Statistics of the Congressional Election of November 2, 2010," accessed March 28, 2013
